Chapter 3: Instrument user interfaces 🔗
You can instrument your user interfaces to send user session data to Splunk RUM. Splunk RUM has several tools that help you monitor the health and behavior of your applications.
Instrument user interfaces to send user sessions 🔗
You can set up Splunk RUM for browser or mobile applications. Follow the setup guide to get started: Set up Splunk RUM for mobile and browser applications.
Use Splunk RUM to view your front-end application data 🔗
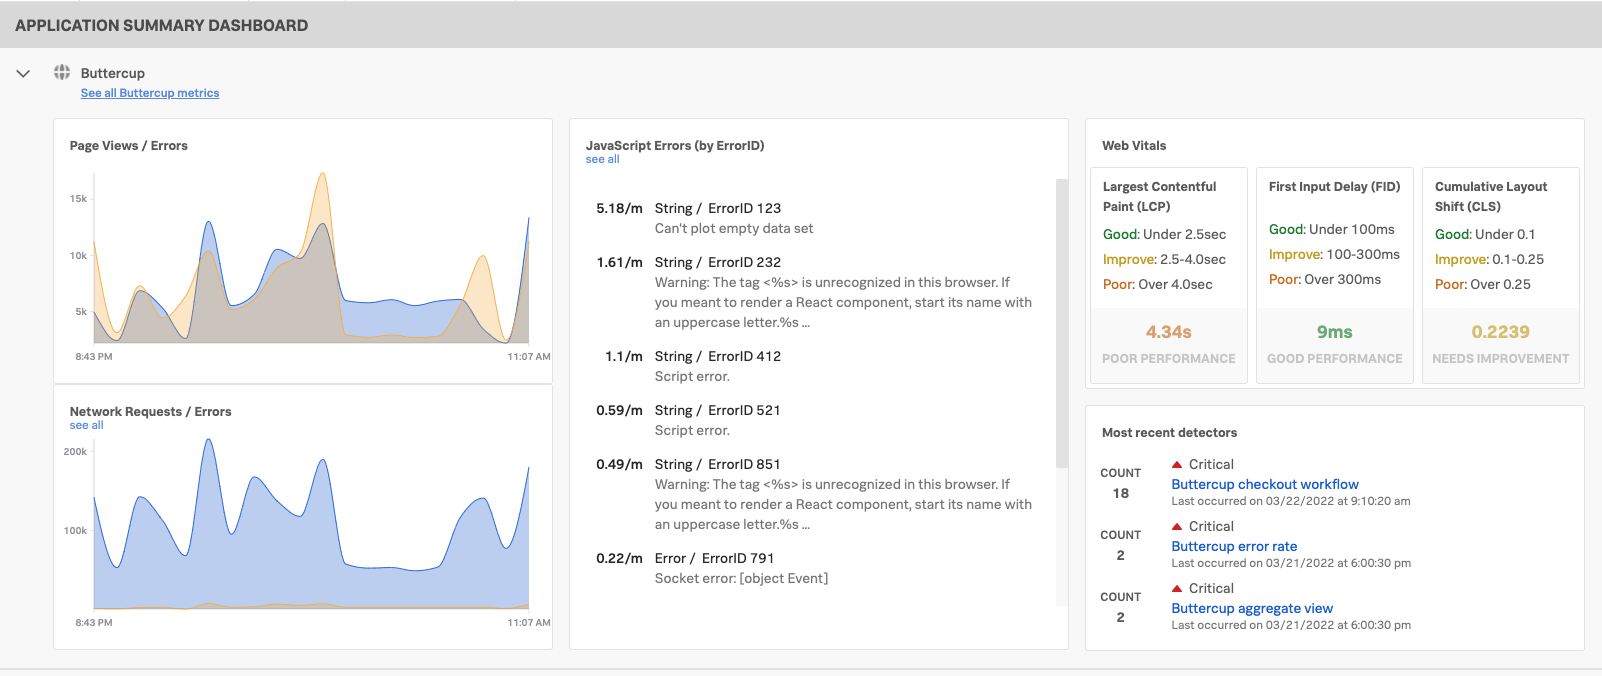
You can instrument browser and mobile user interfaces to monitor front-end application user experiences, sending your user sessions to RUM to review key metrics and vitals, as well as investigate errors in your spans:
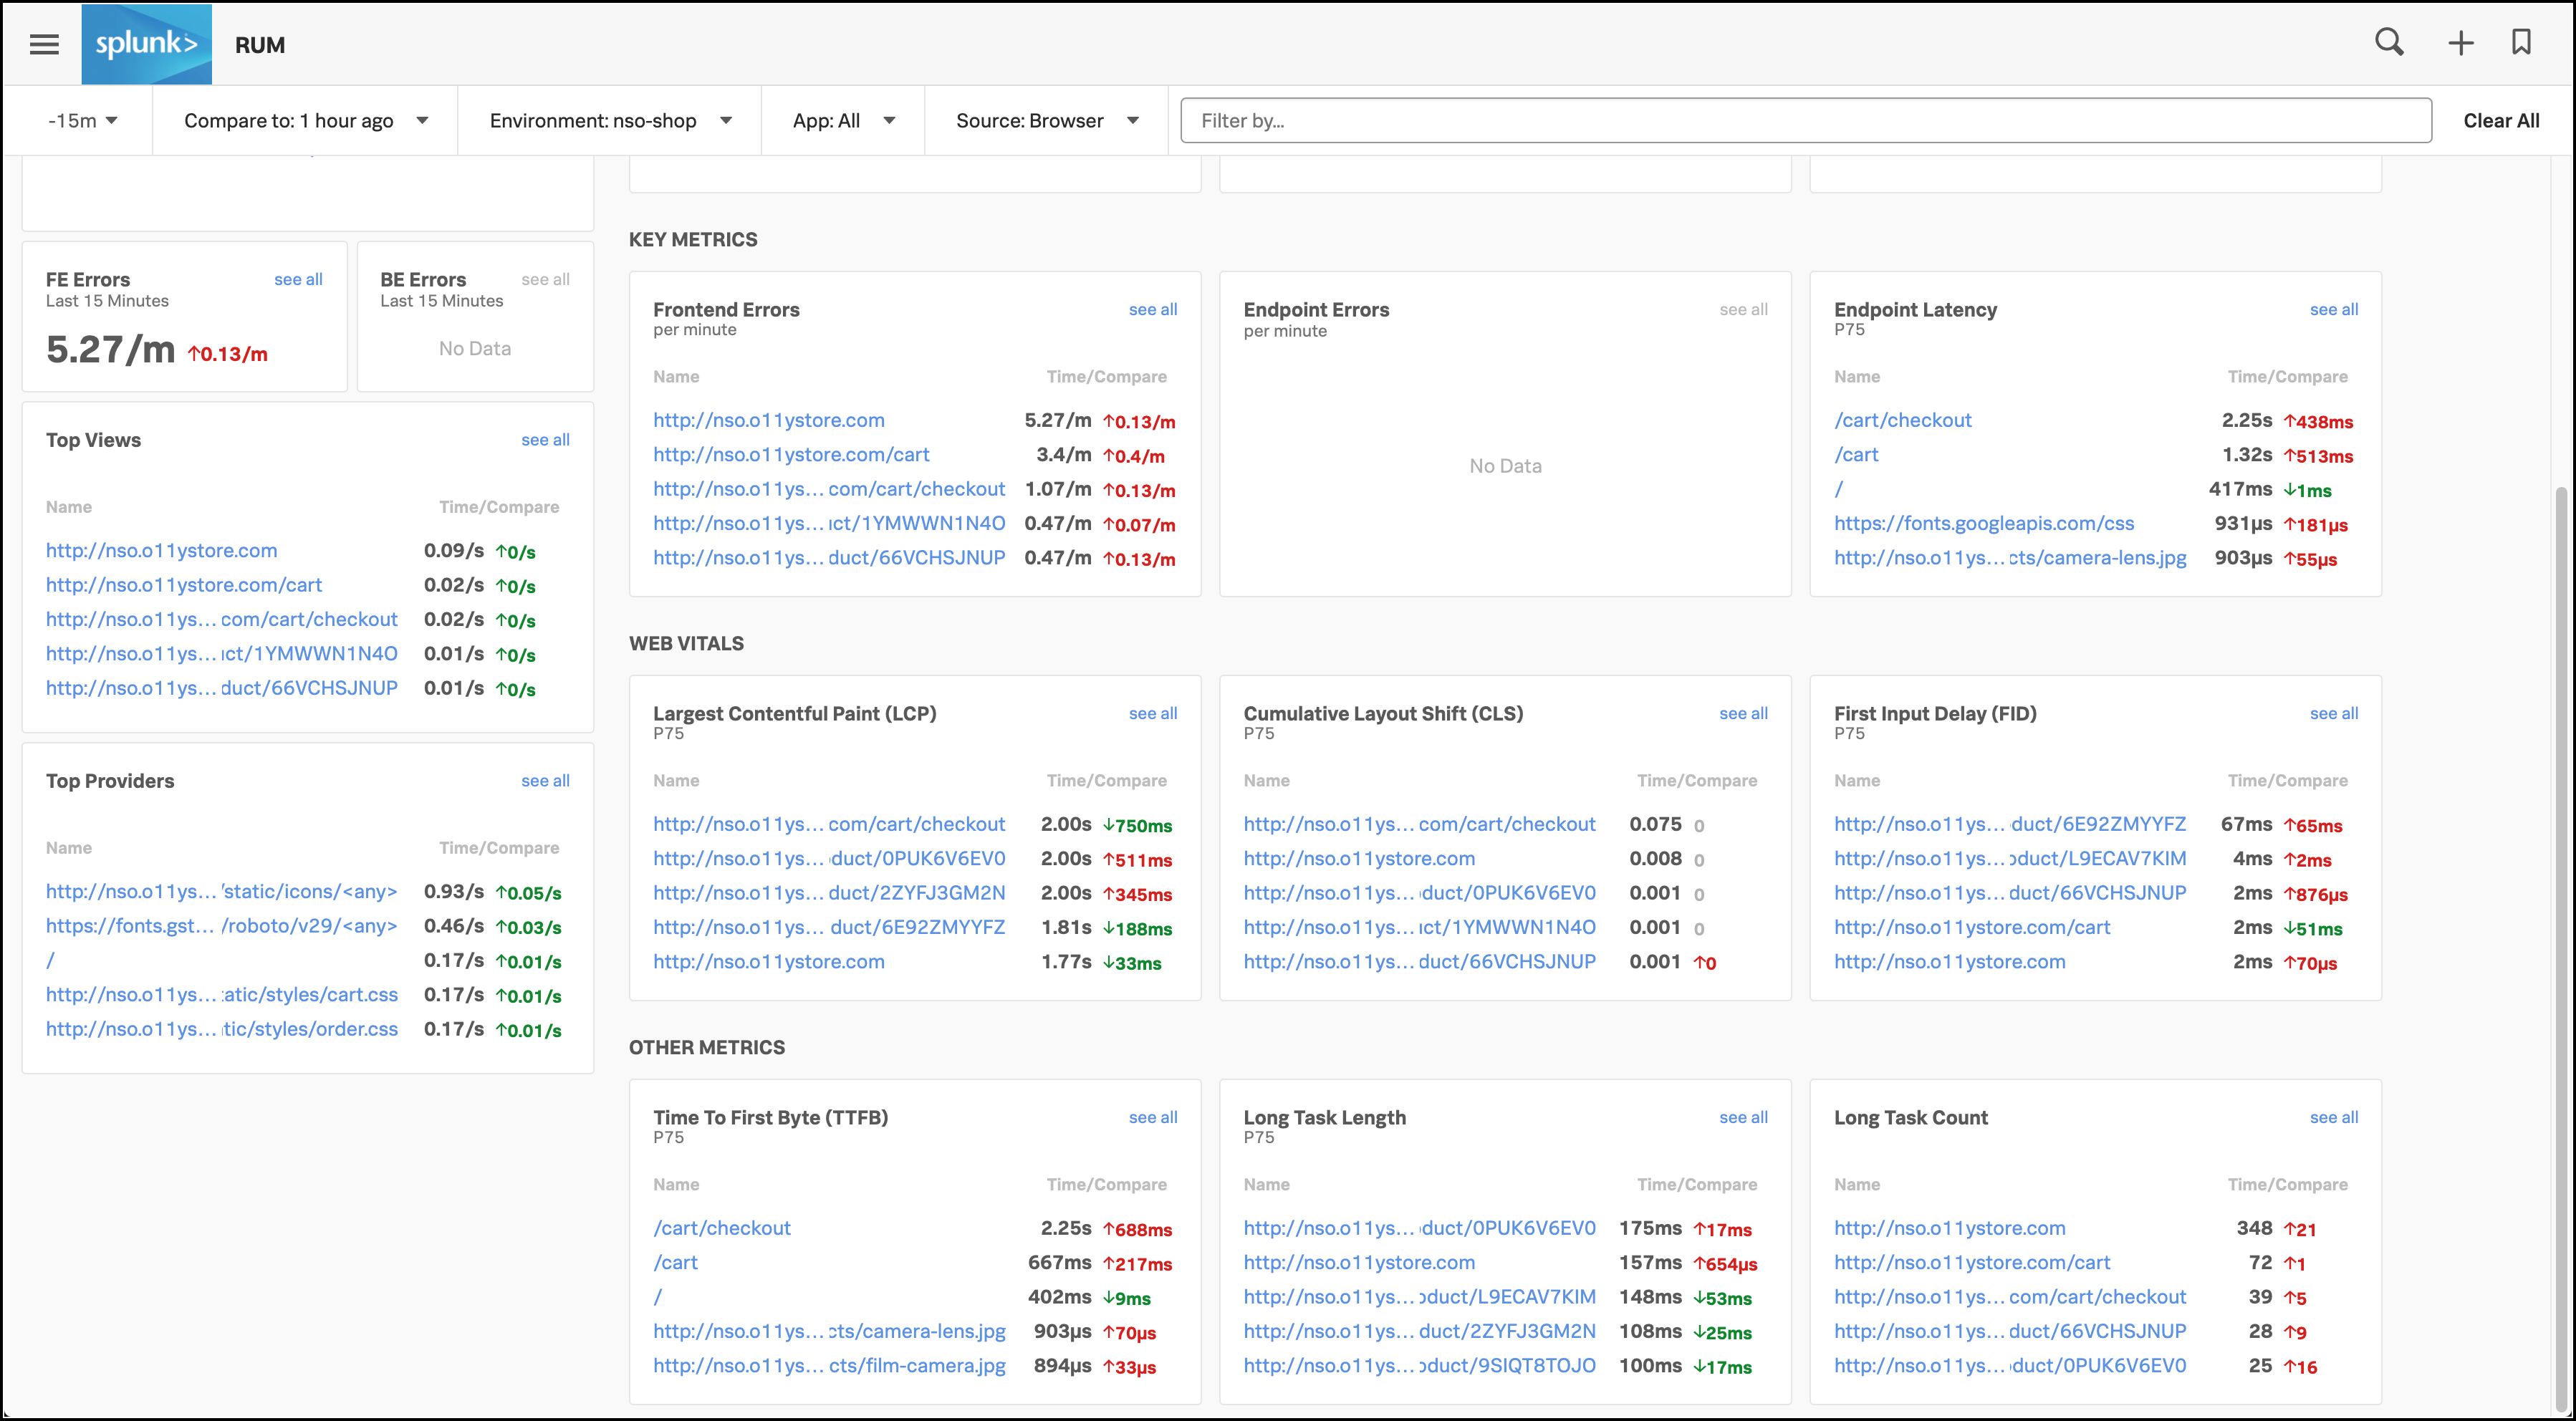
To use Splunk RUM to view your application data, see Splunk RUM built-in dashboards.