Part 2: Install the OpenTelemetry Collector to send server and cluster data 🔗
Install the Splunk Distribution of OpenTelemetry Collector on any hosts or clusters you’re using as a part of your infrastructure, such as servers running in your data center or on a virtual machine running in the cloud to:
Send metrics to Infrastructure Monitoring
Query logs in Log Observer Connect
Set up your environment to receive logs and traces from applications instrumented in Part 1: Instrument back-end services and applications to send traces, logs, and metrics.

Install the OpenTelemetry Collector for your servers or clusters 🔗
To receive infrastructure data from your servers and clusters, install and configure the Splunk Distribution of OpenTelemetry Collector for your server or cluster.
The OpenTelemetry Collector runs as an application or pod and listens for telemetry data from your servers or clusters. After finding data, the Collector sends it to Splunk Infrastructure Monitoring. To learn more about the Collector, see Get started: Understand and use the Collector.
Guided setup 🔗
For a quick setup, you can follow a guided installation process through the Splunk Observability Cloud UI. To do so, see the documentation corresponding to your platform:
Linux: Collect Linux data
Kubernetes Collect Kubernetes data
Windows: Collect Windows data
Manual setup 🔗
If you’re planning to use a more advanced setup for the OpenTelemetry Collector, you can manually install and configure the Collector. To do so, follow the setup guide corresponding to your platform:
View your infrastructure data in Splunk Infrastructure Monitoring 🔗
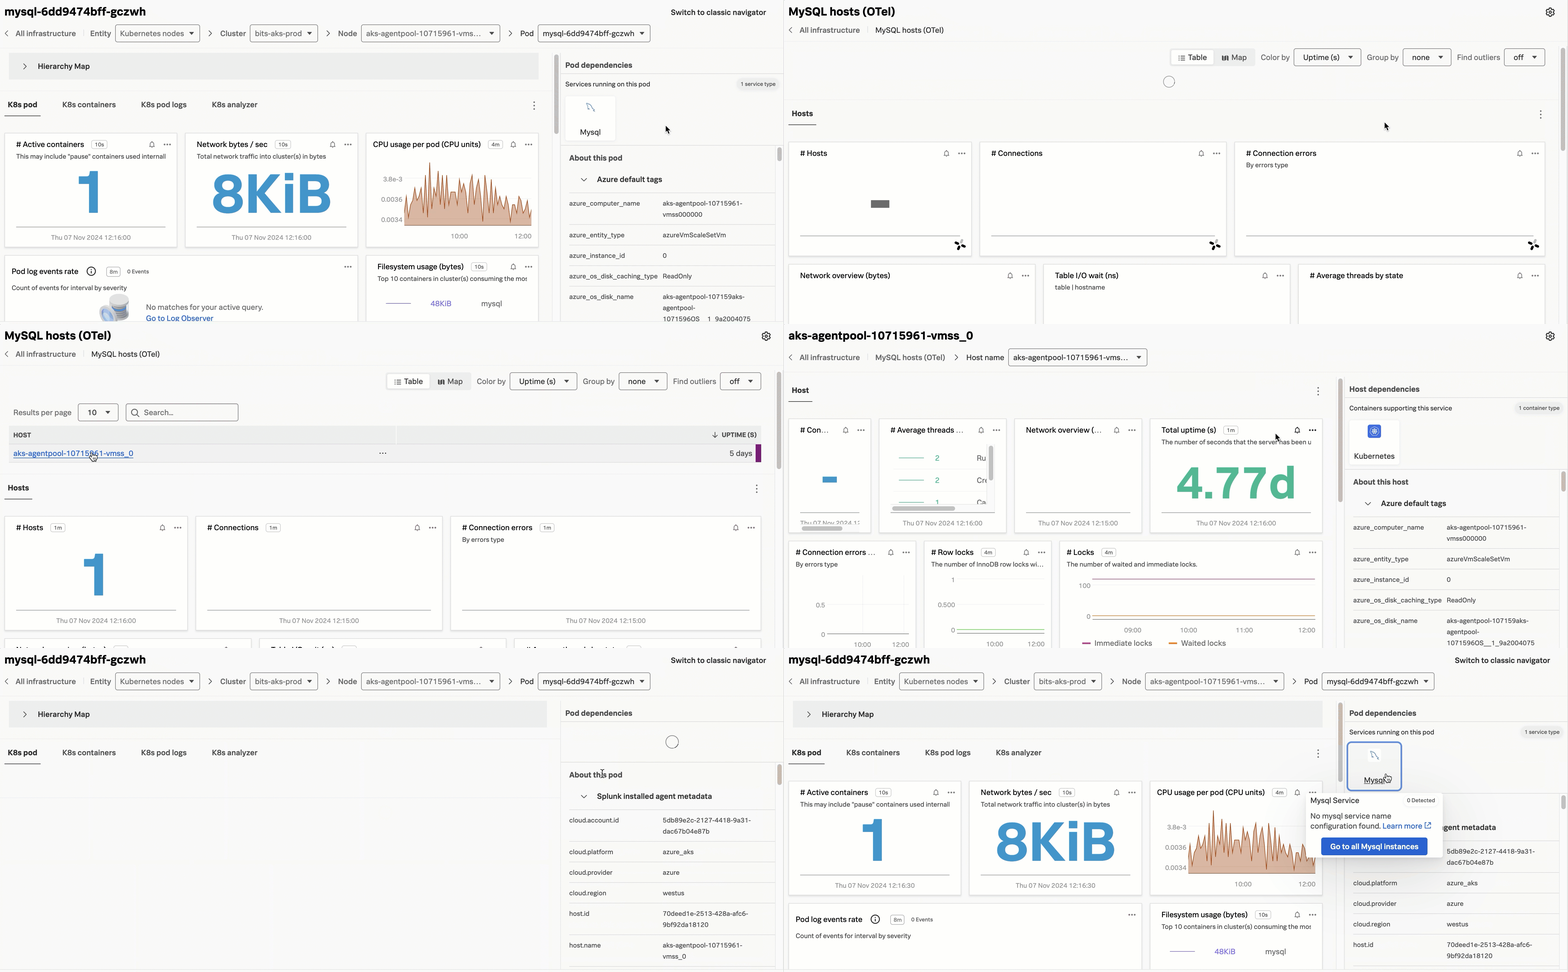
After you’ve installed the Collector and configured your servers and clusters, you can use the following methods to access your data:
If you can see your data in navigators, dashboards, or in the metric finder, then your integration is working.
View metrics in built-in dashboards for hosts and Kubernetes 🔗
Splunk Observability Cloud offers built-in dashboards that display charts for your infrastructure metrics. To find your metrics in these dashboards, see Built-in dashboards.
Search for metrics using the metric finder 🔗
You can find your infrastructure metrics by using the Splunk metric finder. For more details, see Search for metrics in the Metric Finder.
Query logs in Log Observer Connect 🔗
If you chose to ingest logs, you can query them in the Splunk Log Observer Connect. See more at Introduction to Splunk Log Observer Connect.
Next steps 🔗
To finalize setting up your infrastructure, see Part 3: Configure third-party server applications to send metrics, logs, and traces.
