Add data sources to glass tables in ITSI
The dataSources section of the glass table definition in IT Service Intelligence (ITSI) defines the data that powers each visualization. The ds.test data source is used for sample data and the ds.search data source is used for ad hoc searches.
Most of the data source configuration is automated when you create KPI visualizations, ad hoc searches, and charts in the visual editor. For more information about adding visualizations, see Add visualizations to glass tables in ITSI.
ds.test
The ds.test data source is for sample data and is structured by calling the dataSources module followed by the name you provide for the search, the data source type, options, data, and column values and fields.
Expand the following sections to see the structure and an example of ds.test:
ds.test structure
The following code sample shows the structure of ds.test.
"dataSources": {
    "<search_name>": {
        "type": "ds.test",
        "options": {
              "data": {
                 "columns": [
                        [
                            "1",
                            "2",
                            "3",
                            "4",
                            "5",
                            "6",
                            "7",
                            "8"
                        ],
                        [
                            "1",
                            "2",
                            "3",
                            "4",
                            "5",
                            "6",
                            "7",
                            "8"
                        ]
                    ],
                  "fields": [
                        {
                            "name": "foo"
                        },
                        {
                            "name": "bar"
                        }
                    ]
                },
                "meta": {}
            }
        },
ds.test example
The following code sample shows an example of ds.test.
"dataSources": {
       "test_search": {
          "type": "ds.test",
          "options": {
		"data": {
			"columns": [
			   [
			      "splunkd",
			      "splunkd_ui_access",
			      "splunkd_access",
			      "splunk_web_access",
			      "scheduler",
			      "splunk_web_service"
			     ],
			     [
		                "600",
				"525",
				"295",
				"213",
				"122",
				"19"
			      ],
			      [
				 "87.966380",
				 "50.381304",
				 "60.023780",
				 "121.183272",
				 "70.250513",
				 "90.194752"
				]
                                     ],
                                 "fields": [
				{
				  "name": "sourcetype"
						},
						{
						  "name": "count",
						  "type_special": "count"
						},
						{
						   "name": "percent",
						   "type_special": "percent"
						}
				        ]
				},
				"meta": {}
			},
ds.search
The ds.search data source is for ad hoc searches. It's structured by calling the dataSources module followed by the name you provide for the search, the data source type, and any options you want to make available. The only option that is required to return events is the query option, which is an SPL search.
All KPI and ad hoc search visualizations are of type ds.search. For more information, see Add a KPI visualization and Add an ad hoc search visualization.
The following snippet shows the structure of ds.search:
"dataSources": {
       "<search_name>": {
              "type": "ds.search",
              "options": {
              "query": "<your_SPL_search_>"
            }
      }
},
The following snippet shows an example of ds.search:
"dataSources":{
       "BCsearch": {
               "type": "ds.search",
               "options": {
                      "query": "index=buttercupgo_events | head 500",
                      "queryParameters": {
                              "latest": "now",
                              "earliest": "0"
                      },
		      "refresh": "$RefreshRate$",
		      "refreshType": "delay"
                  }
         }
},
Change the glass table refresh interval
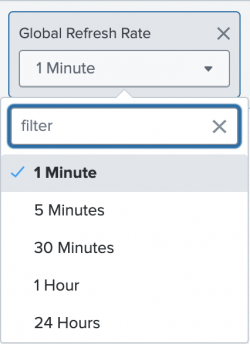
Configure the refresh rate to determine how often the visualizations on your glass table refresh. The global refresh interval, 1 minute by default, applies to all visualizations on your glass table. In the source editor, each visualization has the "refresh": "$RefreshRate$" setting by default.
Use the Refresh Rate dropdown menu to select a global refresh interval:
Set the refresh rate of individual visualizations
To change the refresh rate of a single visualization, perform the following steps:
- Click source
 and locate the search string of the visualization's data source within the
 dataSourcesection. - Configure the
refreshsetting. Format the refresh interval in seconds. For example,"refresh": "300s".
The following visualization refreshes every 30 minutes, or 1800 seconds ("1800s"):
"dataSources":{
       "BCsearch": {
               "type": "ds.search",
               "options": {
                      "query": "index=buttercupgo_events | head 500",
                      "queryParameters": {
                              "latest": "now",
                              "earliest": "0"
                      },
		      "refresh": "1800s",
		      "refreshType": "delay"
                  }
         }
},
| Configure the layout of glass tables in ITSI | Add visualizations to glass tables in ITSI |
This documentation applies to the following versions of Splunk® IT Service Intelligence: 4.11.0, 4.11.1, 4.11.2, 4.11.3, 4.11.4, 4.11.5, 4.11.6, 4.12.0 Cloud only, 4.12.1 Cloud only, 4.12.2 Cloud only, 4.13.0, 4.13.1, 4.13.2, 4.13.3, 4.14.0 Cloud only, 4.14.1 Cloud only, 4.14.2 Cloud only, 4.15.0, 4.15.1, 4.15.2, 4.15.3

 Download manual
Feedback submitted, thanks!