About Splunk App for Infrastructure
Splunk App for Infrastructure is a tool that provides insight into the performance of Linux servers, Microsoft Windows servers, and Amazon EC2, ELB and EBS instances. Splunk App for Infrastructure utilizes metrics for performance monitoring, and log data for deep understanding and troubleshooting of your server infrastructure.
For a video overview of Splunk App for Infrastructure, see Video: Introducing Splunk App for Infrastructure.
Core Features
Splunk App for Infrastructure provides everything you need for deploying metric and log data collection, entity discovery, server monitoring, and performance analysis and troubleshooting. The Insight has the following primary sections.
- The Add Data view gets you started with data collection. From this view you can set up data collection on Linux, Windows, and Mac OS X servers for both system metrics and logs. You can also create accounts for polling critical performance metrics for your Amazon EC2, ELB and EBS entities. See How to add data to Splunk App for Infrastructure below.
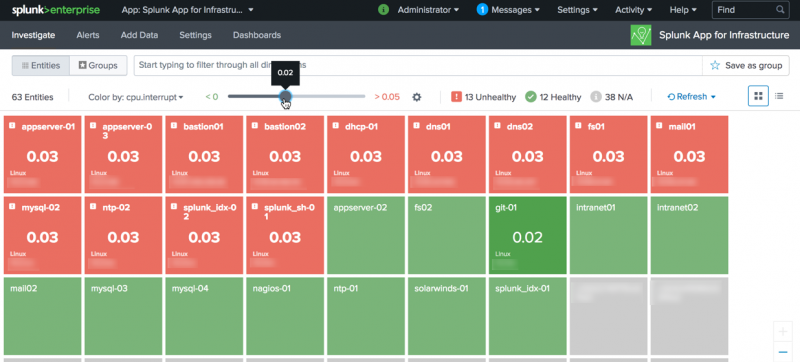
- The Investigate views allow you to browse a list of discovered entities, create groups using entity metadata, view the Entity Overview to monitor the health of an entity, link to Group and Entity Analysis Workspaces for deeper insight, and view all of your server entities as tiles in the Infrastructure Overview. See Investigate Your Infrastructure below.
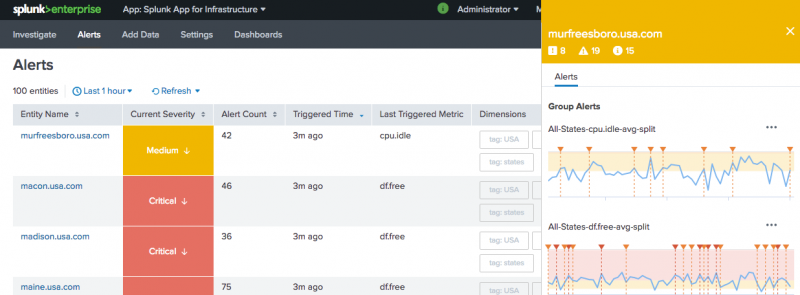
- The Alerts view displays the most recent 100 triggered alert conditions. From this view you can drill down into the Entity Analysis Workspace to perform root cause analysis on a particular alert. See View and Manage Alerts below.
Investigate Your Infrastructure
Use the Investigate views, including the Infrastructure Overview, List View, and Analysis Workspace to monitor your infrastructure.
Investigate the Infrastructure Overview
Monitor the health of your system using the Infrastructure Overview. This view is used to quickly understand availability and performance of your server infrastructure. You can choose a specific performance metric and set a threshold to better understand your high and low performing systems. From this view you can access quick information including hostname and IP address, as well as drill down into the Analysis Workspace for a specific server where you can continue to analyze and understand server performance. For more information, see Using the Infrastructure Overview in Splunk App for Infrastructure.
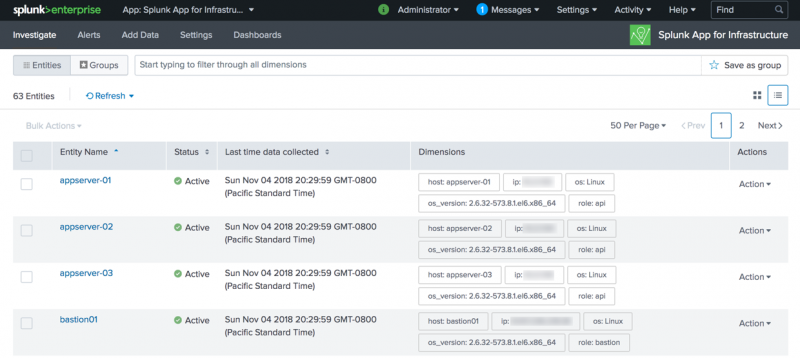
Investigate the List View
Use the List View to view your entities or groups, their status as active or inactive, and sort them by dimensions. You can also drilldown into the Analysis Workspace of an entity or group being monitored to review details or troubleshoot an issue. For more information, see Using the List View in Splunk App for Infrastructure.
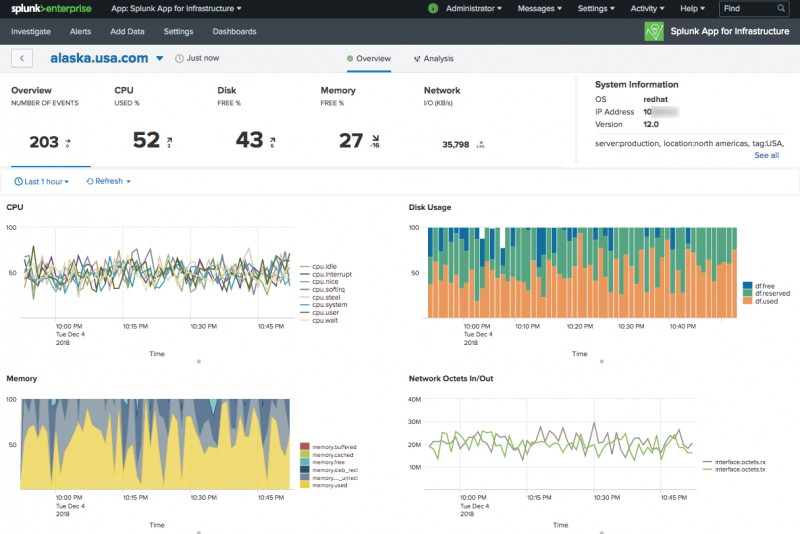
Investigate the Entity Overview
Use the Entity Overview to view performance charts that give a quick view of the performance of Infrastructure entities. From this overview, get a summary of metrics being used by the entity, such as CPU, network, memory, disk, system information, dimensions and more. For more information, see Monitor Entity Health with Splunk App for Infrastructure and Using the Entity Overview in Splunk App for Infrastructure.
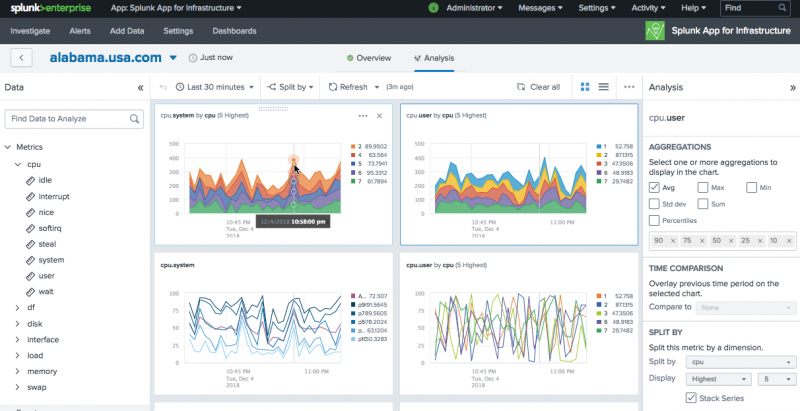
Investigate the Analysis Workspace
Use the Analysis Workspace to analyze performance metrics for a single entity or a group of entities. Determine poor performing entities by metrics, or determine a point in time when multiple entities began performing in a similar way. Create alert conditions and search logs collected from your servers to perform root cause analysis and understand why your infrastructure is performing the way it is. View and search for entities in a group, or view all groups an entity is a part of for easy navigation. For more information, see Analyze Entities and Groups with Splunk App for Infrastructure and Using the Analysis Workspace in Splunk App for Infrastructure.
View and Manage Alerts
Admin privileges are required to create and manage alerts.
Use Alerts to monitor triggered events and perform root cause analysis. The Alerts page displays a list of the last 100 triggered alerts. From here you can link to the Analysis Workspace, where you can continue to investigate performance issues during the time of the alert, modify or delete the alert condition. For more information about alerts, see Using Alerts in Splunk App for Infrastructure.
| Get started using Splunk App for Infrastructure |
This documentation applies to the following versions of Splunk® App for Infrastructure (EOL): 1.2.2, 1.2.3
 Download manual
Feedback submitted, thanks!