Monitor and investigate alerts in Splunk App for Infrastructure
Admin privileges are required to create and manage alerts.
Use alerts to monitor triggered events and perform root cause analysis for a specific behavior in your data. The Alerts page displays a list of the last 100 triggered alerts. From here you can link to the Analysis Workspace, where you can continue to investigate performance issues during the time of the alert. This topic includes information about how to:
- Video: Setting up and using alerts
- Monitor and investigate alerts in the Analysis Workspace
- Monitor and investigate alerts from the Alerts tab
- View alert notifications
- View alert details
Video: Setting up and using alerts
For a video demonstration about setting up and using alerts, see Video: Setting up and using alerts. Alerts must be configured and created by an administrator.
Monitor and investigate alerts in the Analysis Workspace
View and investigate alerts in the Analysis Workspace:
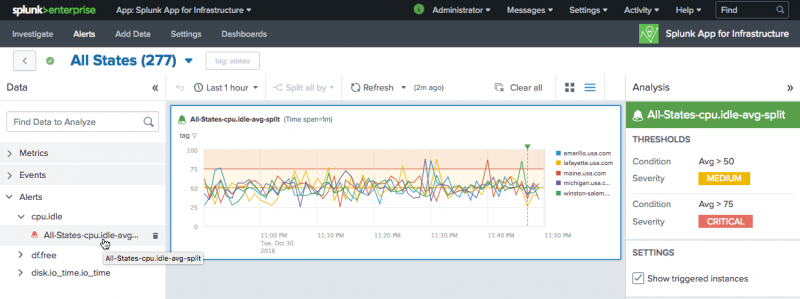
- Click an alert or group from the Investigate page to access the Analysis Workspace.
- Click Alerts in the left Data panel to view a list of alerts that were created for an entity or group.
- Alerts are listed in a tree structure according to the data source they use.
- Click a data source name to see a list of alerts that are based on it, and to view the alert details in the workspace.
- The chart displays color-coded severity levels based upon thresholds set when creating the alert.
For example, the following image shows an Analysis Workspace alert for the cpu.idle metric.
Monitor and investigate alerts from the Alerts tab
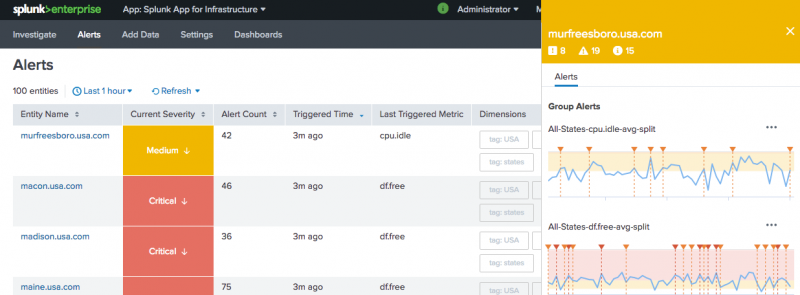
Click the Alerts tab in the menu bar to launch the Alerts page and to view a list of alerts. The Alerts page lists the last 100 triggered alerts.
- When you click an alert, a slideout panel displays on the right of the screen with detailed information about the alert.
- In the slideout panel, click the
 to access the Investigate button to drilldown to the Analysis Workspace and investigate the alert further.
 - The Alerts page displays a color-coded severity status for the state of the alert. This allows you to easily view the state of the alert by color. Severity colors include: Green for Information, Yellow for Medium, and Red for Critical.
- A severity status arrow displays alongside the severity status color in the Currently Severity column, indicating whether the alert has improved or degraded.
- The row size in the Alerts view is limited to two rows per entity. If resizing the window, or if the slide-out panel is activated, the dimensions column truncates and only displays dimensions that fit into the available two-row column size. The row does not expand or wrap to more than two rows, so all dimensions might not display. To view all of the dimensions for each entity or group, close the slide-out panel or resize your window to a larger view.
Alert notifications
When an alert is created by an administrator, there is an option to include an alert notification. This can be an alert notification sent by email or using VictorOps for Splunk. When the alert triggers, one or more notifications are sent depending on the type of alert notification and recipients selected during the alert creation, including:
- an email notification with details of the alert.
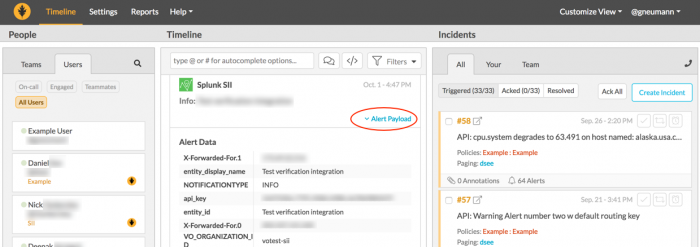
- a VictorOps notification, with the details displaying in your VictorOps account timeline. In your VictorOps account, click Alert Payload link to view details of the alert.
Alert details
Select an alert in the Alerts View or the Analysis Workspace to view its details. These details include the threshold conditions and severity levels configured for the alert, settings, and triggered instances.
- Triggered instances appear as
 annotations on the chart, and up to 100 annotations can display on the chart. Triggered instance annotations appear at the time the alert triggers, not the precise time the alert threshold is crossed.
- Alert badges
 gauge the alert severity level. To help you monitor alert activity, badge colors are based on the most recent severity level of a triggered alert.
| Severity level | Badge color |
|---|---|
| No trigger | Gray |
| Info | Green |
| Medium | Yellow |
| Critical | Red |
Example
The following alert shows CPU user average for the cpu.user metric.
This alert is based on the aggregate average of cpu.user metric values. The green alert badge indicates a severity level of Info, yellow for medium, and red for critical. The horizontal lines show the alert threshold values. The ![]() annotations show triggered instances for the alert.
annotations show triggered instances for the alert.
| Analyze Entities and Groups with Splunk App for Infrastructure | Monitor CPU usage using Splunk App for Infrastructure |
This documentation applies to the following versions of Splunk® App for Infrastructure (EOL): 1.2.1, 1.2.2, 1.2.3


 Download manual
Feedback submitted, thanks!