Using the Infrastructure Overview in Splunk App for Infrastructure
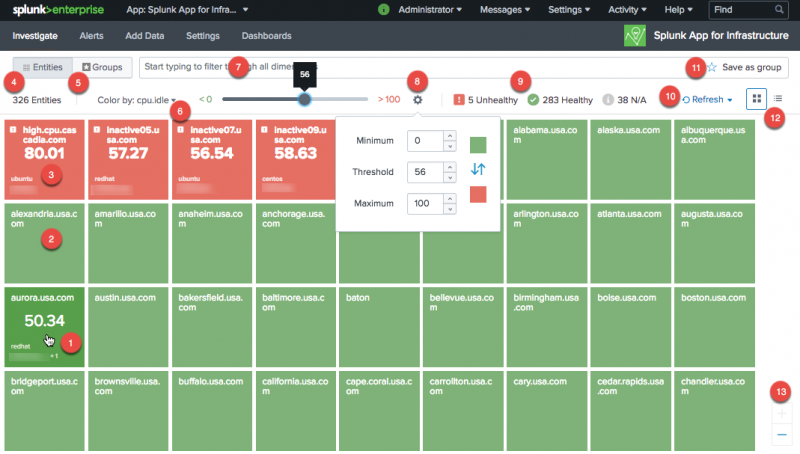
Monitor the health of your system using the Infrastructure Overview. This view is used to quickly understand availability and performance of your server infrastructure. Choose a specific performance metric and set a threshold to better understand your high and low performing systems.
From this view you can quickly access information including hostname and IP address, as well as drill down to the Overview Dashboard and Analysis Workspace for a specific server where you can continue to analyze and understand server performance.
| Number | Element | Description |
|---|---|---|
| 1 | Get details of an active entity | Hover your mouse over a tile to display the name of the entity, time of activity for the entity, IP address, and operating system information. Click the tile to drilldown to the Analysis Workspace to further monitor the entity. |
| 2 | Active entity | Green tiles indicate the entity is active. The name of the entity is displayed in the tile, and you can hover your mouse over the tile to display more information about the entity. |
| 3 | Inactive entity | Red tiles indicate the entity is inactive. The name of the entity is displayed, along with the time the entity has been inactive, the operating system, and the IP address. Click the tile to drilldown to the Analysis Workspace to troubleshoot the reason why the entity is inactive. |
| 4 | Number of Entities | Number of monitored entities available to in your infrastructure. |
| 5 | Display Entities or Groups | Select to display entities or groups in the Infrastructure Overview. |
| 6 | Filter by metric | Click the dropdown menu and select to display the entities by metric. |
| 7 | Filter by dimensions | Filter the display by dimensions. Start typing in the field to filter through all dimensions and display them in the Infrastructure Overview. Click the star to save your selections as a group, for easier monitoring. |
| 8 | Set threshold value for selected metric | Set the minimum and maximum metric thresholds values for the entities or groups displayed in the overview workspace. This allows you to visually monitor healthy and unhealthy entities or groups as they display as green or red in the workspace, based upon their threshold setting. |
| 9 | Unhealthy, healthy, and inactive entity or group count | The number of unhealthy, healthy , or inactive entities or groups are displayed by count. |
| 10 | Refresh | Select how often to refresh the overview workspace. You can set to Auto Refresh, refresh in seconds or minutes, or set refresh to off. |
| 11 | Save as group | Click the star icon to create a group based upon the dimensions you select in the filter bar. Saving entities that have similar dimensions as a group allows you to easily monitor them. |
| 12 | Display the Infrastructure Overview or List View | Select to display the Infrastructure Overview by tile view or list view. The display shown is the Infrastructure Overview. |
| 13 | Minimize of maximize tiles in view | Minimize or maximize the tile size in the Infrastructure Overview. If you minimize the tiles, you can see more tiles in the overview for easy visualization of your infrastructure. If you maximize the tiles, you will not see as many entities, although you will see more details about each entity. |
| 14 | No metric available for entity | A grey tile indicates there is no metric available for the entity. |
| Monitor CPU resource utilization using Splunk App for Infrastructure | Using the List View in Splunk App for Infrastructure |
This documentation applies to the following versions of Splunk® App for Infrastructure (EOL): 1.2.2, 1.2.3

 Download manual
Feedback submitted, thanks!