Monitor CPU resource utilization using Splunk App for Infrastructure
You can create an alert to notify you when your CPU.system is running at a high level. For example, a server is running at 100% of CPU.system utilization for the past 15 minutes. This is affecting the performance of server, and degrading application delivery and user experience.
Problem: Too many duplicated processes and threads are running at the same time, due to a bug in a patch that was deployed. The server is running 100% on cpu.system for the past 15 minutes.
Resolution: Set up an alert to issue a warning when the average CPU.system utilization is greater than 89 percent, for a period of 15 minutes or more.
Admin privileges required to configure and manage alerts.
Steps
Step 1: Investigate the entity for which you want to set an alert
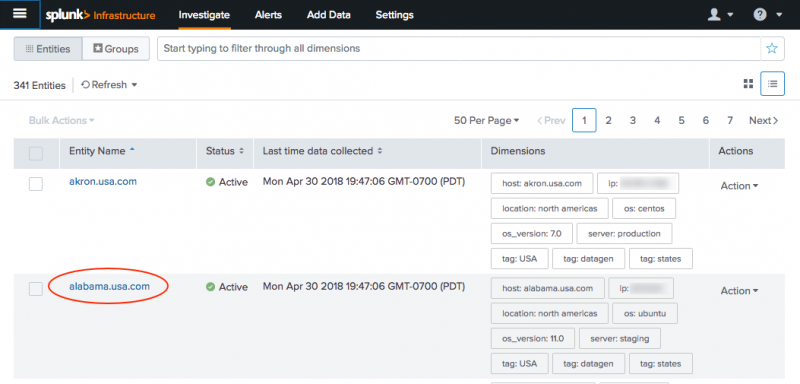
- Click the Investigate tab to display a list of your entities.
- Click the entity for which you want to set an alert and drilldown to the Analysis Workspace
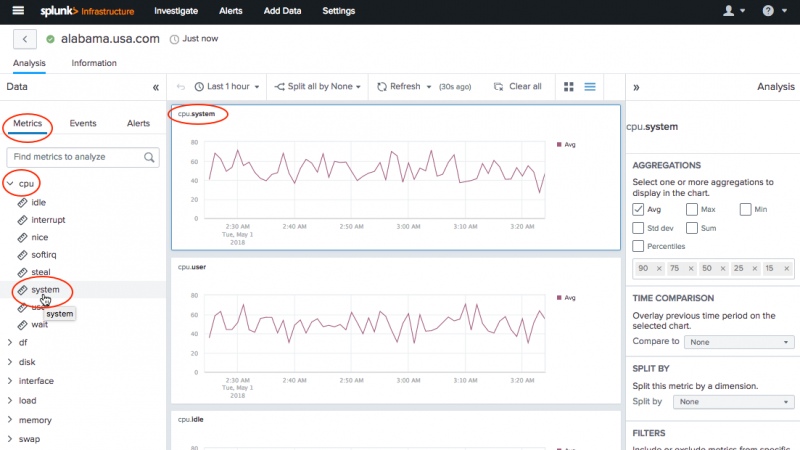
Step 2: Select the metric to set the alert
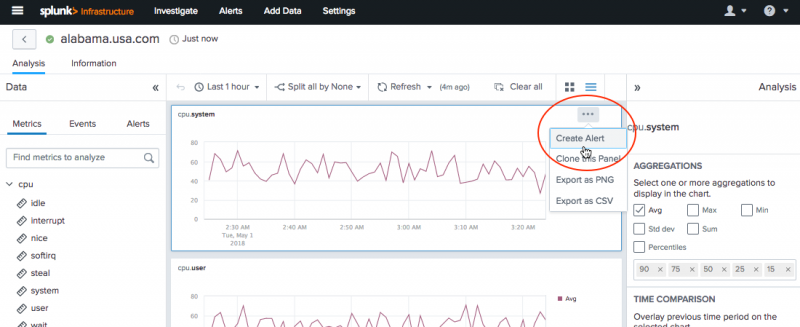
Step 3: Save the chart as an alert
Step 4: Configure the alert
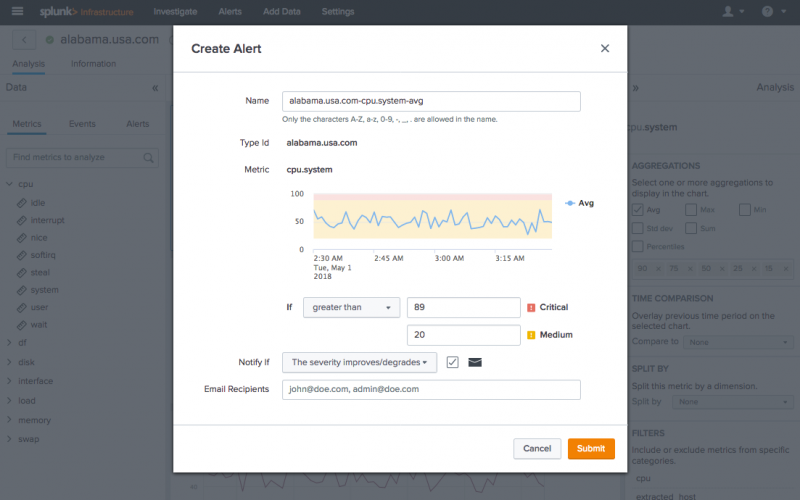
- Enter information to create an alert:
- Name: The alert is automatically given an alert name. Change the name if desired, following the character requirements.
- Type Id: The entity or group name is displayed.
- Metric: The type of metric selected for the chart, along with data analysis information.
- Trigger Actions: Enter thresholds for alert trigger conditions.
- Notify if: Select to notify a recipient if the alert severity improves or degrades.
- Send email: Check the box next to the envelope to send an email when the alert triggers.
- Enter Recipients: Enter email address(es) for alert notification recipients.
- Click Submit.
Step 5: Display alerts as a chart in the Analysis Workspace
- Click the Alerts tab to display the created alert.
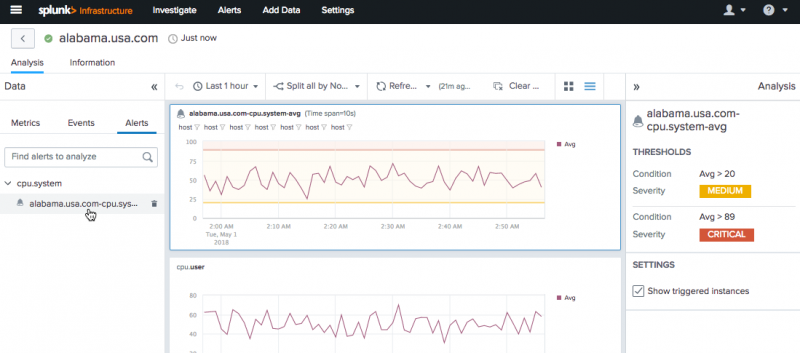
- Click the alert from the list to display the alert as a chart. This allows you to monitor the alert in the main panel view. When an alert triggers, the icon and chart displays the alert color, and alert details display in the right Analysis panel.
Step 6: View triggered alerts from the Alerts List View
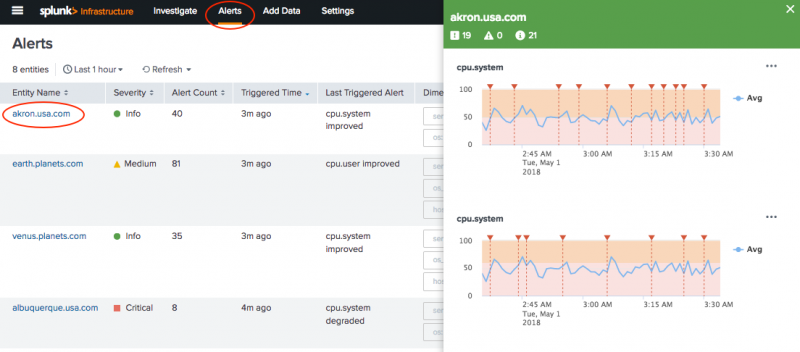
You can view your most recent triggered alerts from the Alerts List View.
- Click Alerts in the menu bar at the top of the user interface.
- Click an entity or group to view more details about the alert in the right slide-out panel. The following screen shows akron.usa.com
Summary
You now have an alert that will notify you by email if your entity's cpu.system reaches 89% or more.
| Monitor CPU usage using Splunk App for Infrastructure | Using the Infrastructure Overview in Splunk App for Infrastructure |
This documentation applies to the following versions of Splunk® App for Infrastructure (EOL): 1.2.0, 1.2.1, 1.2.2, 1.2.3
 Download manual
Feedback submitted, thanks!