Configure the Splunk App for Microsoft Exchange
This topic discusses how to configure the Splunk App for Microsoft Exchange, and describes what you see when you run the app for the first time.
First time configuration
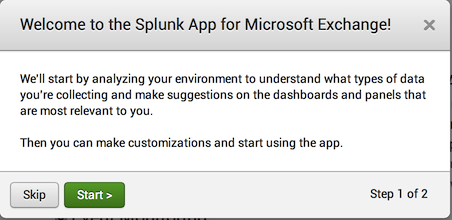
After you install the Splunk App for Microsoft Exchange, when you load the app, it presents you with the following dialog box:
This dialog box lets the Splunk App for Microsoft Exchange detect what data has already been collected and determine which dashboards it should display. While you do not need to let it run the detection process, it is a good idea to do so.
To begin the detection process, click the green Start button in the dialog box. To skip the detection process, click the Skip button.
If you click the "Skip" button, the Splunk App for Microsoft Exchange displays the main configuration page.
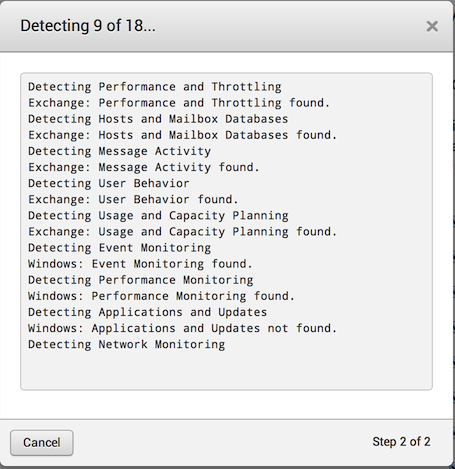
If you click the "Start" button, the app displays the "Detecting" dialog box as it searches for existing data:
You can stop the detection progress at any time by clicking the Cancel button in the lower left corner of the dialog box.
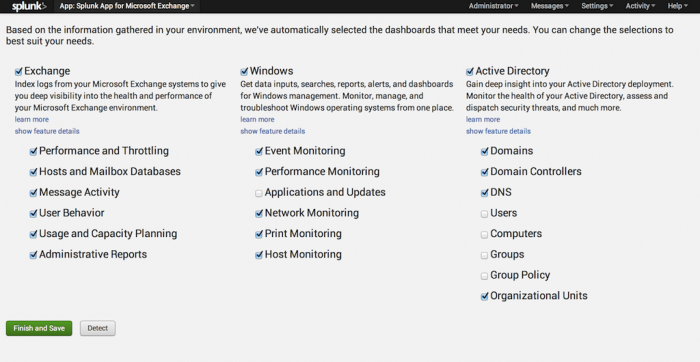
Once the detection process has completed, the "Cancel" button becomes a Close button which, when you click it, clears the detection dialog box and shows the following page:
This is the main configuration panel for the Splunk App for Microsoft Exchange. The page divides into three sections:
- Exchange: This section displays options based on data that has already been collected with the Splunk App for Microsoft Exchange. Like the other sections, the Splunk App for Microsoft Exchange enables these checkboxes if it finds that Exchange data has been collected during the detection process. You can enable the whole section or select which options you would like the app to display by clicking the appropriate checkbox.
You can then choose whether or not the Splunk App for Microsoft Exchange should display this data by checking - or clearing - the checkbox beside each type of Exchange data. If you click the check box next to "Exchange" at the top, the Splunk App for Microsoft Exchange enables all dashboards in the Exchange section.
- Windows: This configuration section displays options based on data that has already been collected with the Splunk App for Windows and the Windows inputs in the core Splunk Enterprise product. If the Splunk App for Microsoft Exchange detects that Windows data has been collected, it enables the checkbox next to the type of Windows data that has been collected. Each of these entries is also a dashboard in the Splunk App for Microsoft Exchange.
- Active Directory: This section displays options based on data that has already been collected with the Splunk App for Active Directory and associated Active Directory inputs in the core Splunk Enterprise product. If the Splunk App for Microsoft Exchange detects that Active Directory data has been collected, it enables the checkbox next to the type of Active Directory data that is present. Each of these entries is also a dashboard.
Important: This configuration page relies on data that has already been collected. If you have not collected any data, then the detection process will not enable any dashboards.
If you skipped the detection process, the Splunk App for Microsoft Exchange displays this page with all dashboards enabled.
Once you have confirmed the dashboards you want to enable, click the Finish and Save button to go to the main Splunk App for Microsoft Exchange page.
You can also click the Detect button to run the detection process again.
| Log in and get started | Dashboard reference |
This documentation applies to the following versions of Splunk® App for Microsoft Exchange (EOL): 3.0, 3.0.1, 3.0.2, 3.0.3


 Download manual
Feedback submitted, thanks!