Client Access Servers
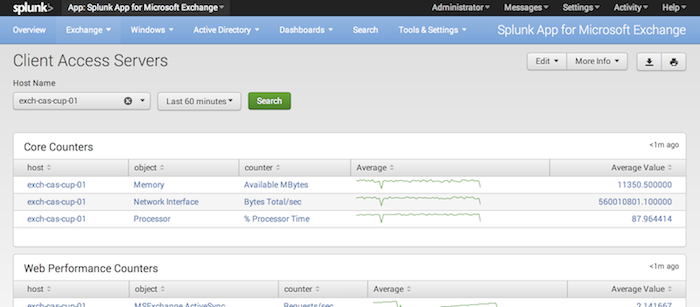
This page displays information about the performance of the Client Access Servers in your Microsoft Exchange deployment.
The page breaks down into several panels:
- The Core Counters panel shows you information about core performance counters (percent CPU used, available memory, and network usage) for your Client Access Server systems. The panels include a sparkline that displays average values for each counter.
- The Web Performance Counters panel shows you information about Outlook Web Access and ActiveSync requests per second.
- The POP3 and IMAP4 Performance panel shows you the current and rejected connections over these protocols, and the processing time associated with them.
- The Client Throttling Counters panel shows when Exchange has throttled clients to maintain performance.
How to use this page
- In the Host Name drop down, select the CAS host you want to get information on.
- Optionally, use the time picker to select the range of time that you want the panels to display.
- For each panel, you can sort the contents by clicking on the column header button. Clicking more than once on the same column header toggles between ascending and descending sort based on that column.
- You can mouse over the spark line in the "Average" column to see individual data points for the chosen metric.
- You can click on any point in the spark line to load the "Perfmon" page for the selected host, performance object, and performance counter.
| Host Performance Reports | Hub Transports |
This documentation applies to the following versions of Splunk® App for Microsoft Exchange (EOL): 3.4.1

 Download manual
Feedback submitted, thanks!