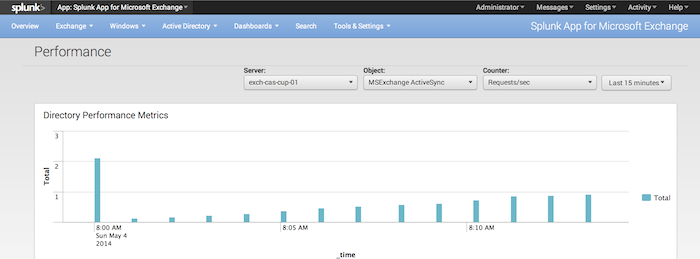
Directory Performance
This dashboard lets you view all AD-related performance metrics across all domain controllers in your AD forest in a chart.
How to use this page
To view a metric, select the desired domain controller from the Server drop-down list on the top of the dashboard. Then, select the performance Object and, finally, the desired Counter in the same fashion.
The Splunk App for Microsoft Exchange displays the chart on the lower portion of the dashboard.
You can also adjust how much data is displayed by selecting the time range you desire in the time range picker on the upper right side of the dashboard.
| Domain Replication Issues | User Overview |
This documentation applies to the following versions of Splunk® App for Microsoft Exchange (EOL): 3.4.1

 Download manual
Feedback submitted, thanks!