Component health page
Overview
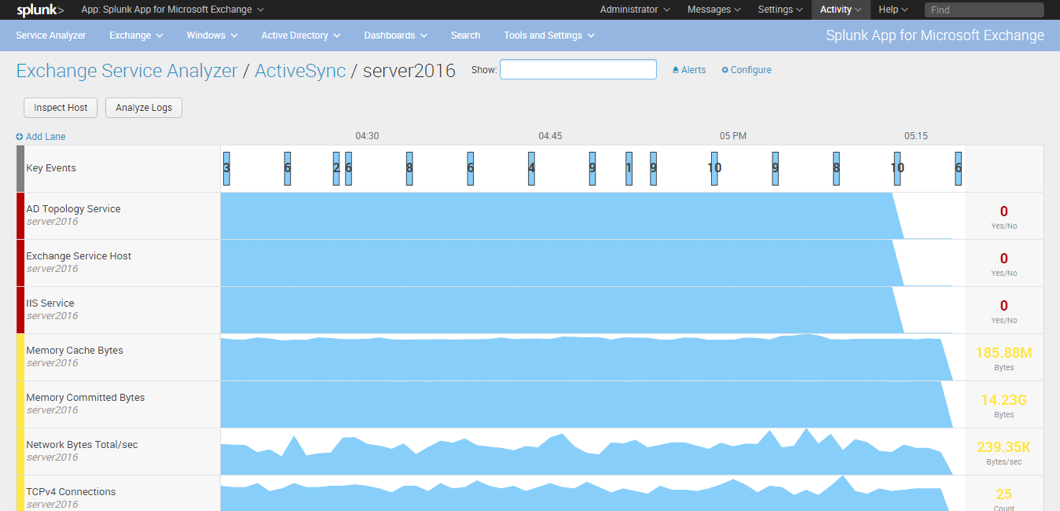
The component health page shows the status of all components - event logs and performance counters - that are associated with the selected host for the selected Exchange service.
The component health page depicts each component as a swim lane that shows the following information:
- A color strip that represents the overall health of the service component. This strip can be green, yellow, red, or gray, depending on its status. Only performance log components have color strips. See "Color meanings" later in this topic.
- The name of the event log or performance counter. The name of the host is below this entry.
- A swim lane/chart that shows the most recent activity of the event log or performance counter. This chart corresponds to the amount of time shown in the time picker on the page.
- A numeric display that shows the most recent status of the performance counter.
The lanes display based on information you enter in various controls on the page. See "How to use this page."
Color meanings
The color strips can be one of four colors, and gives you an indication of the health of the component:
- Green: OK. This means that the object currently operates within the thresholds determined by Microsoft to be within nominal limits for the object. See Common Thresholds on MS TechNet.
- Yellow: Warning. This means that the object currently operates outside of nominal thresholds, as defined by Microsoft for the service, but is not yet in a failure state. Objects that show yellow indicate a potential problem that should be addressed before they progress to red.
- Red: Error. This means that the object currently operates in a state that Microsoft considers to be in error for the service. This indicates a failure state and the counters that show this state indicate a problem that must be addressed immediately.
- Gray: No Data. This means that the object does not currently return any data for the service. This is an indication that data for this object is not coming into the Splunk App for Microsoft Exchange and you should investigate why.
How to use this page
The component swim lanes show the current status of all of the performance counters associated with the selected host in the selected service.
By default, objects in the Error state appear at the top of the page, objects in the Warning state appear below those in the Error state, and objects in the OK state appear below those in the Warning state.
Filter objects based on status
You can limit the amount of swim lanes you see by clicking on the Show field. A pop-up list appears with the following entries:
- Errors: Only show objects in the Error state (red).
- Warnings: Only show objects in the Warning state (yellow).
- OK: Only show objects in the OK state.
- No Data: Only show objects that have no data present.
You can filter on multiple objects, for example "Error" and "No Data". Do this by clicking the "Show" field multiple times and selecting entries from the pop-up list.
To remove filters, click on the "x" next to their entry in the "Show" field.
The Splunk App for Microsoft Exchange updates whenever you add or remove a filter entry.
Configure alerts
Click the Alerts link to configure alerts for the Splunk App for Microsoft Exchange.
Configure components
Click the Configure link to configure the components for the selected Exchange service.
Inspect Host
Click the Inspect Host button to go to the Host Inventory page for the selected host.
Analyze Logs
Click the Analyze Logs button to load the Log Analyzer page for the selected host.
View key events
The Splunk App for Microsoft Exchange lists notable events logged by the host. To view an event, click it in the swim lane. The Splunk App for Microsoft Exchange opens a window that displays the event and the time and date that it occurred.
Click the event to open a Search window that shows the whole event.
Add a swim lane
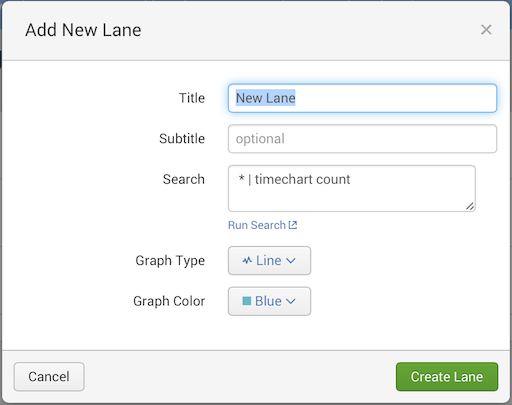
To add a new lane, click the "Add lane' link at the top of the swim lanes. The Splunk App for Microsoft Exchange loads the "Add new lane" dialog:
- In the Title field, enter the title for the new lane.
- In the Subtitle field, enter a subtitle for the lane.
- For the Search field, enter a search for the lane that generates the data you want the lane to show.
- After you enter the search, click the Run search link to see if the search generates the results you want.
- Choose the Graph Type by picking an entry from the list: Line, Area, Column, or Heat Map.
- Choose the Graph Color by picking an entry from the list.
- Click Save. The Splunk App for Microsoft Exchange adds the lane to the Component Health page.
You can then edit the lane as shown in the options listed later in this topic.
Change the positioning of swim lanes
To change the position of a swim lane, click and hold its title bar, then drag the swim lane up or down until it is where you want it to be in the list.
Hide a swim lane
You can hide swim lanes for services that might not be relevant to whatever problem you are trying to resolve at the current time. Hiding swim lanes lets you see only the services that matter and increases the amount of space available on the page.
To hide a swim lane, mouse over its title bar. In the upper right corner of the title bar is a caret symbol. Click this symbol to significantly reduce the size of the lane.
To restore the lane, mouse over the reduced lane until you see the downward pointing caret. Click the symbol to restore the lane to its normal size.
Disable a swim lane
To disable a component swim lane;
- Mouse over its title bar.
- In the lower right corner of the title bar is a cog. Click the cog and a pop-up menu appears.
- Select Disable from this menu. The Splunk App for Microsoft Exchange brings up the "Disable Component" dialog.
- Click Disable. The Splunk App for Microsoft Exchange stops tracking the counter.
This option only appears in component swim lanes.
Delete a swim lane
You can delete swim lanes for services that you do not monitor in your deployment.
To delete an Event Log swim lane;
- Mouse over its title bar.
- In the lower right corner of the title bar is a cog. Click the cog and a pop-up menu appears.
- Select Delete from this menu. The Splunk App for Microsoft Exchange brings up the "Delete Lane" dialog.
- Click Delete. The Splunk App for Microsoft Exchange deletes the lane.
This option only appears in Event Log swim lanes.
Change thresholds of a swim lane
To change the thresholds (when the Splunk App for Microsoft Exchange shows the status colors) of a component swim lane:
- Mouse over its title bar.
- In the lower right corner of the title bar is a cog. Click the cog and a pop-up menu appears.
- Select Thresholds from this menu. The Splunk App for Microsoft Exchange loads the "Change thresholds" page.
This option only appears in component swim lanes
View data and events
To view specific Key Application Score (KAS) numbers for a component, mouse over the graph in the swim lane for the component. As you move the mouse over the data, the Splunk App for Microsoft Exchange shows the number that the graph represents at the location of the mouse cursor.
Change the default time range
The default time range - or Primary Time Range - for the swim lanes appears in a time picker at the bottom left corner of the page. You might need to scroll down to see this time picker.
To change the primer time range, click the time picker and choose a value that suits your needs. Once you have, click Apply. The Splunk App for Microsoft Exchange updates the view based on the new time range.
Drill down into events
To view more granular data and events, such as a potential problem area (a spike or a dip in the swim lane graph):
- Move the cursor to just before the area you want to view.
- Click and drag your mouse cursor. A selection box appears.
- Continue dragging until the selection box is around the area that you want to drill down into.
- Release the mouse button. The Splunk App for Microsoft Exchange updates the page to show only the events and counter data points in the time range (view port) that you selected.
| Service Health page | Log analyzer |
This documentation applies to the following versions of Splunk® App for Microsoft Exchange (EOL): 3.4.1


 Download manual
Feedback submitted, thanks!