Log analyzer
Overview
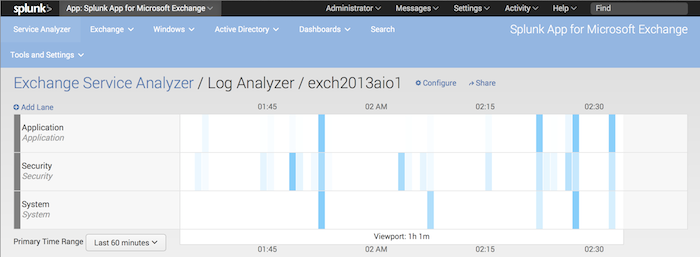
The Log Analyzer page is like the Component Health page in that it shows you swim lanes for various components associated with the host that you selected in the Service Health page. There are some differences:
- This page only shows logs for the selected host.
- Instead of showing a line graph that depicts numbers, it shows heat maps that represent when the logs received activity.
How to use this page
Configure Log Analyzer
Click the Configure button to configure the Log Analyzer page.
Add a swim lane
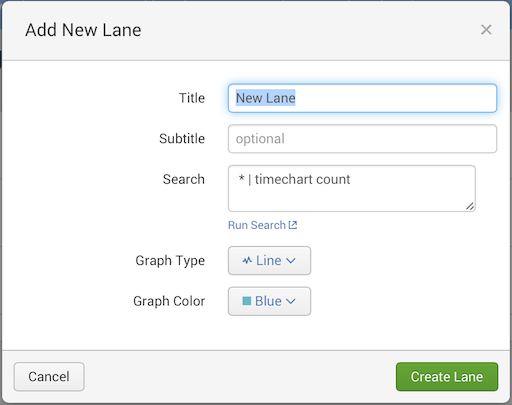
To add a new lane, click the "Add lane' link at the top of the swim lanes. The Splunk App for Microsoft Exchange loads the "Add new lane" dialog:
1. In the Title field, enter the title for the new lane.
2. In the Subtitle field, enter a subtitle for the lane.
3. For the Search field, enter a search for the lane that generates the data you want the lane to show.
- Once you have entered the search, click the Run search link to see if the search generates the results you want.
4. Choose the Graph Type by picking an entry from the list: Line, Area, Column, or Heat Map.
5. Choose the Graph Color by picking an entry from the list.
6. Click Save. The Splunk App for Microsoft Exchange adds the lane to the Component Health page.
You can then edit the lane as shown in the options listed later in this topic.
Change the positioning of swim lanes
To change the position of a swim lane, click and hold its title bar, then drag the swim lane up or down until it is where you want it to be in the list.
Hide a swim lane
To hide a swim lane, mouse over its title bar. In the upper right corner of the title bar is a caret symbol. Click this symbol to significantly reduce the size of the lane.
To restore the lane, mouse over the reduced lane until you see the downward pointing caret. Click the symbol to restore the lane to its normal size.
Edit a swim lane
To change the thresholds (when the Splunk App for Microsoft Exchange shows the status colors) of a swim lane:
1. Mouse over its title bar.
2. In the lower right corner of the title bar is a cog. Click the cog and a pop-up menu appears.
3. Select Edit Lane from this menu. The Splunk App for Microsoft Exchange loads the "Edit Lane" dialog.
4. In the Title field, enter the title for the lane.
5. In the Subtitle field, enter a subtitle for the lane.
6. For the Search field, enter a search for the lane that generates the data you want the lane to show.
- Once you have entered the search, click the Run search link to see if the search generates the results you want.
7. Choose the Graph Type by picking an entry from the list: Line, Area, Column, or Heat Map.
8. Choose the Graph Color by picking an entry from the list.
9. Click Save. The Splunk App for Microsoft Exchange updates the lane.
Delete a swim lane
To disable a swim lane;
1. Mouse over its title bar.
2. In the lower right corner of the title bar is a cog. Click the cog and a pop-up menu appears.
3. Select Delete from this menu. The Splunk App for Microsoft Exchange brings up the "Delete Lane" dialog.
'4. Click "Delete. The Splunk App for Microsoft Exchange deletes the lane.
View data and events
To view specific Key Application Score (KAS) numbers for a component, mouse over the graph in the swim lane for the component. As you move the mouse over the data, the Splunk App for Microsoft Exchange shows the number that the graph represents at the location of the mouse cursor.
Change the default time range
The default time range - or Primary Time Range - for the swim lanes appears in a time picker at the bottom left corner of the page. You might need to scroll down to see this time picker.
To change the primer time range, click the time picker and choose a value that suits your needs. Once you have, click Apply. The Splunk App for Microsoft Exchange updates the view based on the new time range.
Drill down into events
To view more granular event occurrences, such as a potential problem area (a cluster of events in the heat map):
1. Move the cursor to just before the area you want to view.
2. Click and drag your mouse cursor. A selection box appears.
3. Continue dragging until the selection box is around the area that you want to drill down into.
4. Release the mouse button. The Splunk App for Microsoft Exchange updates the page to show only the events in the updated time range (view port) that you selected.
Click the Share link to get a page that shows a link that you can copy and paste into an email message or chat window.
| Component health page | Configure alerts |
This documentation applies to the following versions of Splunk® App for Microsoft Exchange (EOL): 3.4.1


 Download manual
Feedback submitted, thanks!