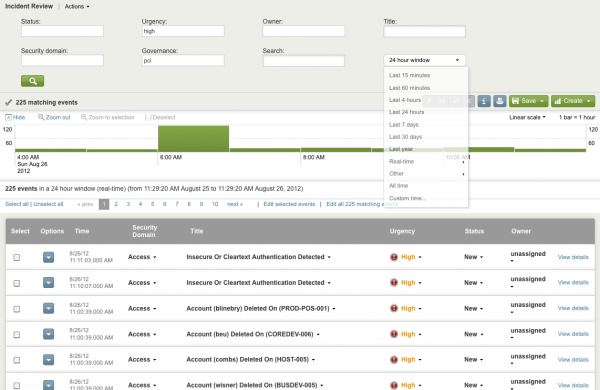
Incident Review dashboard
The Incident Review dashboard shows the current incidents in your PCI compliance environment, by selected time period. Use the drop-down menu to select a time range to investigate. Use the filters to narrow your search to specific types of events or areas.
When you identify an event to investigate, use this window to gather more information about the event.
Filters available for this window:
| Filter | Description |
|---|---|
| Status | Status of the event (for example, New, Open, or Closed) |
| Urgency | Level of the event urgency (for example, Low, Medium, High, or Critical) |
| Owner | The current owner of the event (the default is "unassigned") |
| Title | Automatically assigned to the event |
| Security domain | Domain in which the event occurred (for example, Access) |
| Governance | The area of governance (default is "pci") |
| Search | Add additional search parameters to this field |
| time window | Select a time range for the search |
Click on the timeline for more details about an event.
| PCI Compliance Posture dashboard | Scorecards |
This documentation applies to the following versions of Splunk® App for PCI Compliance: 2.1.1

 Download manual
Feedback submitted, thanks!