What is the Explorer?
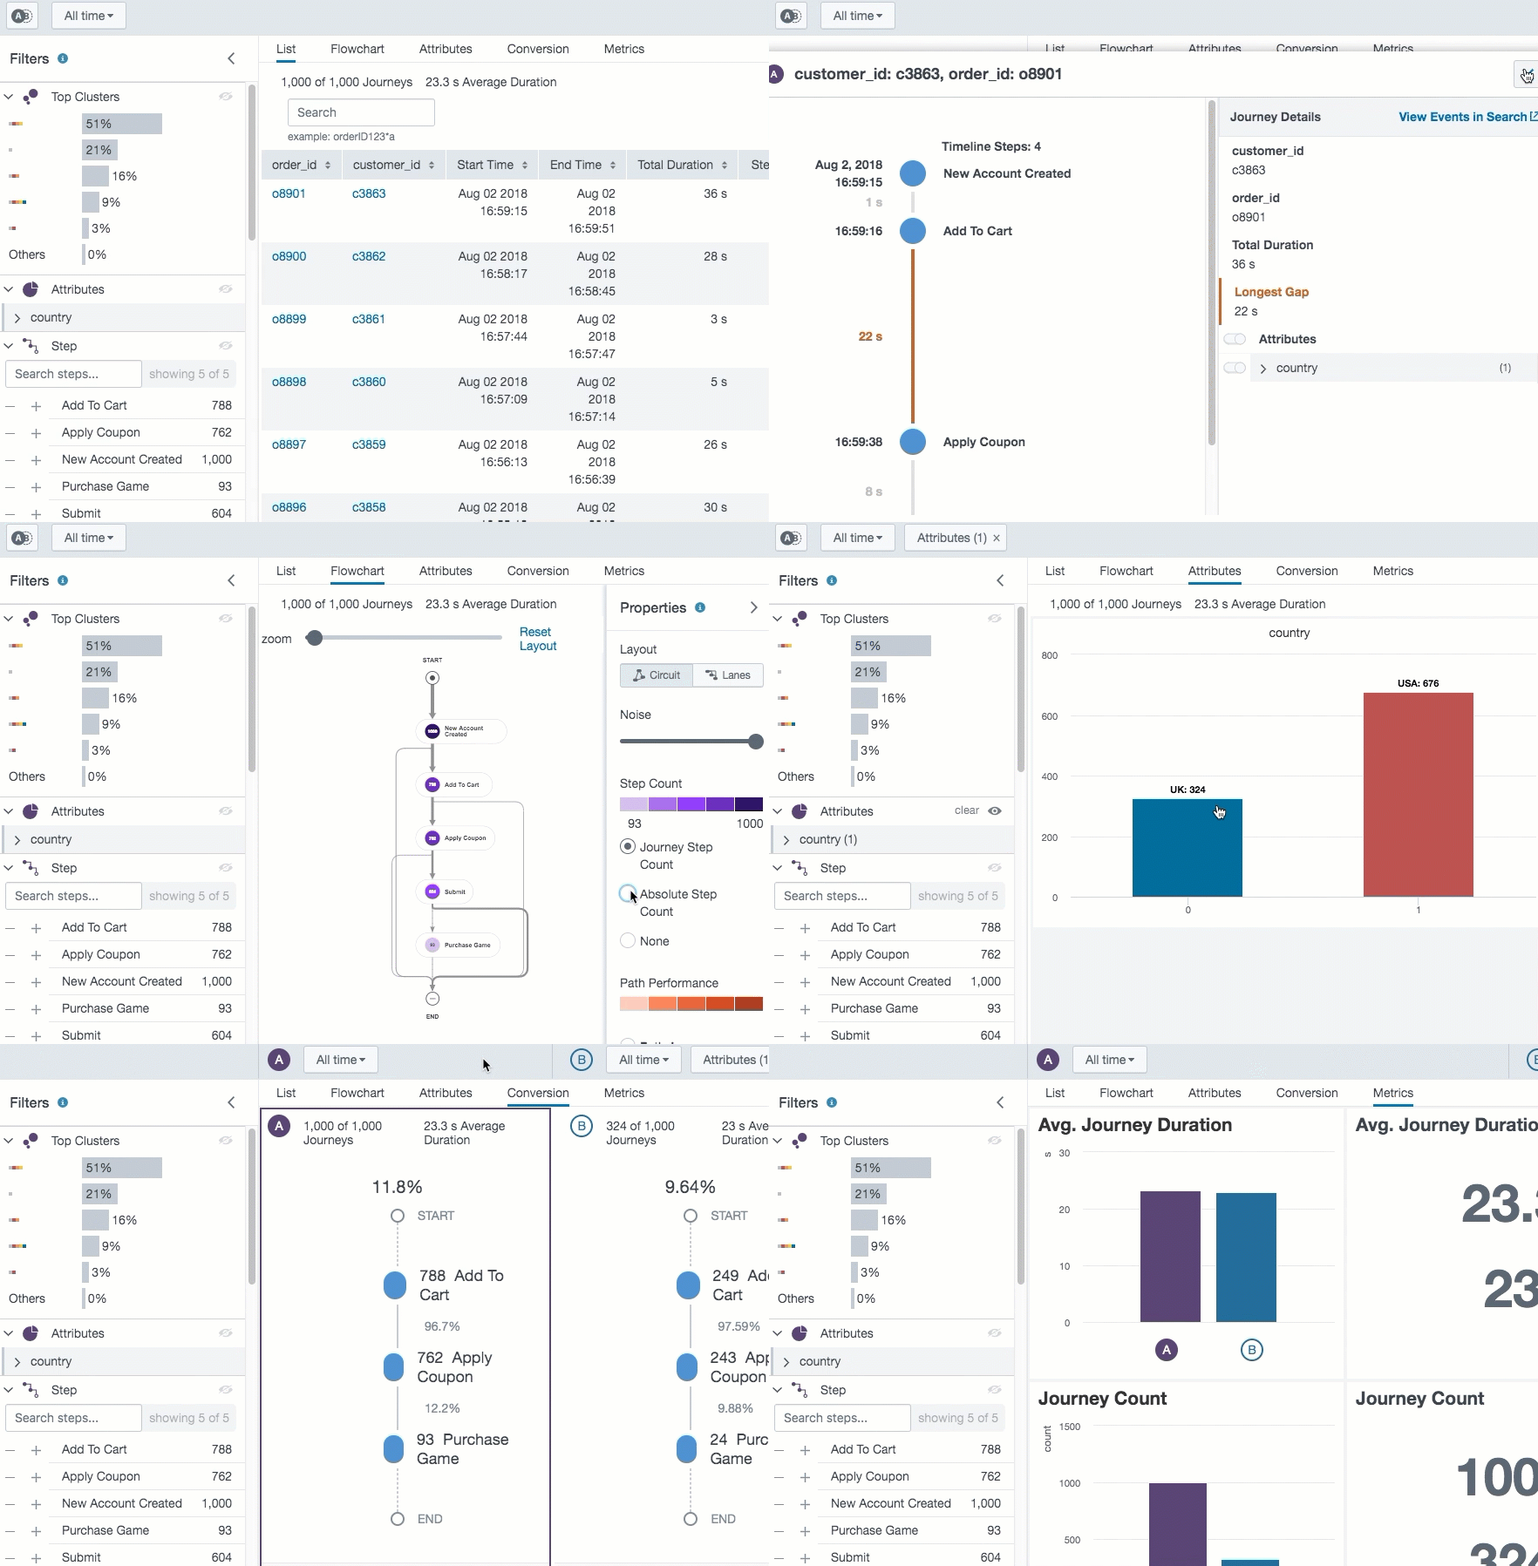
The Explorer is an interactive space for you to analyze Journeys and create visualizations. In the Explorer, you can perform AB comparison testing, calculate Journey conversion rates, summarize metrics, and filter Journeys by attributes. After you preview your data, save your analysis as a Flow.
The following animation illustrates how to filter Journeys by attribute, calculate a conversion rate and enable the AB comparison view.
Feature reference
The following topics walk through each feature in the Explorer.
Enable High Contrast Mode
If you want to present your Flowchart, enable High Contrast Mode in the Configuration page. High Contrast Mode increases the contrast and saturation of colors displayed in the Flowchart to account for projectors or monitors with poor color resolution.
- Click the gear icon to open the Configuration page.
- Toggle the High Contrast Mode to on.
Filters
Apply filters to sort Journeys by Attribute, time, step, or step sequence.
Conversion
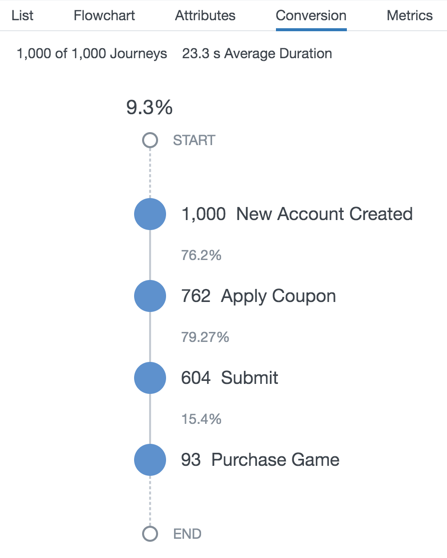
Select a step or sequence of steps in the Conversion funnel to calculate how many Journeys completed each step. In this example from the Buttercup Games Store data set, out of 1000 Journeys, 762 Journeys completed the Apply Coupon step, 604 Journeys submitted the order step, and 93 Journeys completed the purchase step.
Flowchart
The Flowchart feature groups a collection of Journeys into a single, ordered sequence of steps. For more on how SBF groups Journeys into the Flowchart, see Terminology and concepts in Splunk Business Flow. Drag and drop the steps in the flowchart to rearrange the steps in the Flowchart. To revert the layout to the default, click Reset Layout.
The following image shows the Circuit view of the Flowchart.
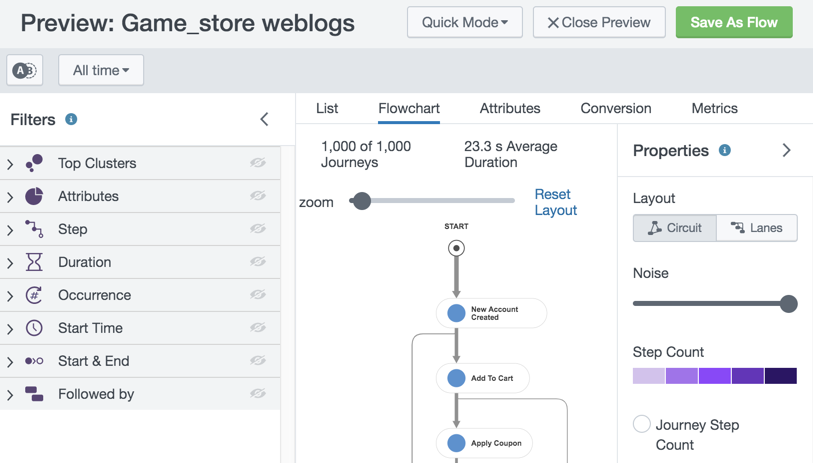
The following table walks through the features in the Properties panel of the Flowchart.
| Name | Description |
|---|---|
| Layout | There are two views in the Flowchart: the Circuit and Swim Lanes. |
| Noise | The Noise slider filters out steps that did not occur in the percentile of Journeys shown. To see more common steps, move the Noise slider to the left. For example, If you move the Noise slider to the left to 0.1, the Flowchart shows all the steps that occurred in 90% of the Journeys. |
| Step Count | Journey Step Count is the number of Journeys that contain a particular step. Absolute step count is the total number of times a step appears across all Journeys. For example, consider the following Journeys. Journey 1: A, B, D, E, E, F. Journey 1: B, D,E, G, Z. Step E has an Absolute Step Count of 3 because the step appears a total of three times. Step E has a Journey step count of 2 because it appears in two Journeys.
|
| Path Performance | A path is the span between two steps in a Journey. Select Path Count to view the number of times a step occurs after the proceeding step. For example, suppose you have the following steps in a Journey: add-to-cart, apply coupon, purchase item, payment accepted. If you select the Path Count view, you can see how many times the apply coupon step occurs after the add-to-cart step in the Flowchart. Select Path Avg. Duration to see the average amount of time between a step. |
A/B comparison
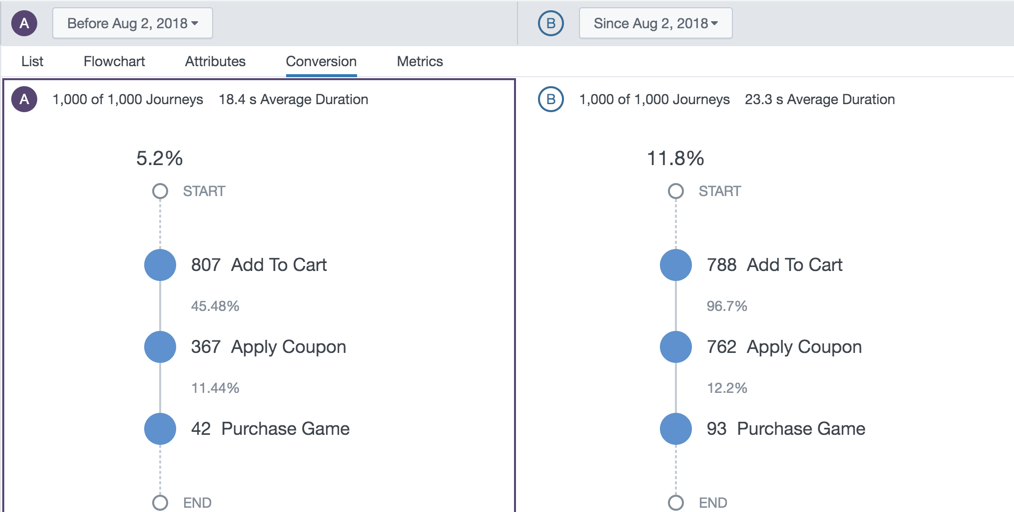
Apply the ![]() comparison view to compare Journeys in your Flow Model. You can enable the A/B comparison View on the List, Flowchart, Attribute, Conversion, and Metrics tabs.
comparison view to compare Journeys in your Flow Model. You can enable the A/B comparison View on the List, Flowchart, Attribute, Conversion, and Metrics tabs.
In this example, the A/B comparison mode shows the difference between Journey conversion rates for the same sequences of steps based on the date.
List
To investigate details of an individual Journey, open the Journey Instance view in the List feature. In the Journey Instance view, you can identify the longest gap between steps and review the timeline of the Journey. You can sort Journeys in the list view by step sequence, duration, start and end time and Correlation ID.
This image show an example of the Journey Instance view enabled.

| Name | Description |
|---|---|
| Start Time | Toggle Start Time to sort Journeys by earliest and latest Start Time. |
| End Time | Toggle End Time to sort Journeys by earliest and latest End Time. |
| Total Duration | Toggle Total Duration to sort Journeys by longest or shortest duration. |
| Step Count | Toggle Step Count to sort Journeys based on the number of steps in the Journey. |
| Sequence: Sort by Complexity | Select Complexity to sort Journeys based on the number of distinct steps contained in each Journey. |
| Sequence: Sort by Repetition | Select the Repetition view to sort Journeys based on the frequency of an immediately recurring step |
| Sequence: Sort by Starting | Select Starting to view Journeys based on the longest sequence of an immediately recurring step at the beginning of a Journey. |
| Sequence: Sort by Ending | Select Ending to view Journeys based on the longest sequence of an immediately recurring step at the end of a Journey. |
Attributes
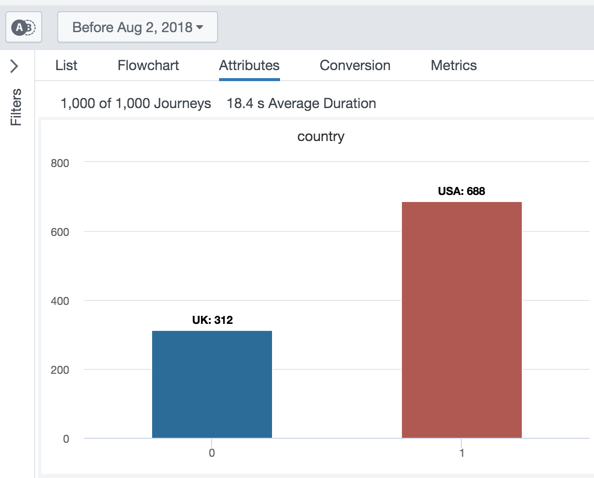
The Attribute view shows the breakdown of your Journeys by Attribute field value. SBF shows only the top twenty attributes values. Click on a field value to apply a filter to your Journeys. The following example illustrates the field values for the Country Attribute in the Buttercup Games Store data set.
Metrics
In the Metrics tab, you can see various stats on your Journeys and numeric Attributes. The following table walks through the selections in the Properties panel.
| Metric | Description |
|---|---|
| Avg. Journey Duration | The average Journey duration. |
| Journey Count | The total number of Journeys. |
| Conversion Rate | The conversion rate from the conversion funnel you selected in the Conversion tab. |
| Numeric Attribute | The Total is to the sum of all numeric values for the selected Numeric Attribute. The Average is computed by summing all numeric values for the selected Numeric Attribute across each Journey, then taking the average of the sums across all Journeys. |
This documentation applies to the following versions of Splunk® Business Flow (EOL): -Latest-
 Download manual
Feedback submitted, thanks!