Add secondary data sources to your visualization
In addition to the single, primary type of data source that drives your main visualization, you can also specify an event annotation as a secondary data source. An event annotation helps provide context with different visualization aspects.
Add event annotations to your visualization
Event annotations allow you to add context to the trends returned by your charts. For example, if you have a chart that shows website login errors over the last week, you can add an event annotation that uses an audit index to flag the times when your servers were down over that period. If the majority of the login errors occurred when your servers were down, you might conclude that the two events are related. Using event annotations in this way gives you the ability to correlate discrete data sets.
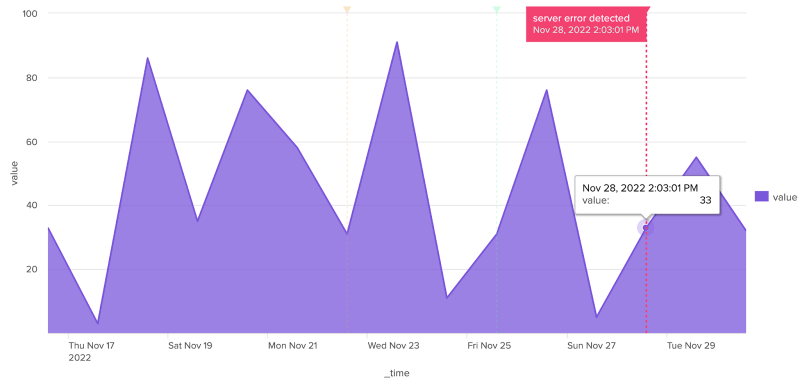
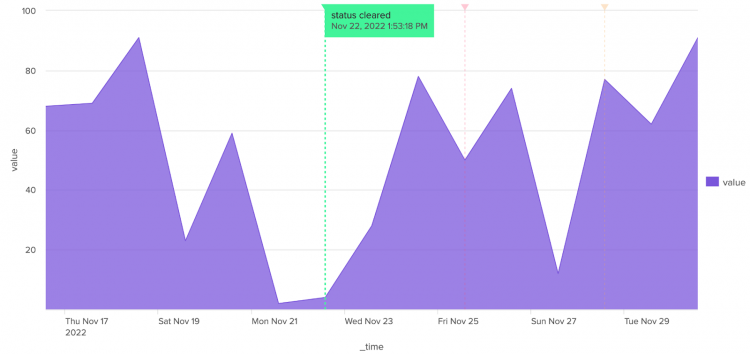
Event annotations look like colored flags that display time stamp information and custom descriptions in labels when you hover your cursor over them, as shown in the following example:
Only area, bar, column, and line charts support event annotations.
If you set a refresh delay for your primary data source, you must manually add the same refresh time in the source code for the event annotation search.
The elements of an annotation search
You use the following search elements when creating an event annotation as a secondary search with a visualization:
- It must include a field that matches the x-axis of the primary data source.
A common example is_time. - Add a message to the flag (optional).
When you create an annotation, you can add a message to the flag that appears when you hover over the top of the annotation marker. To do this, make sure to create the field in your search. For example:
This example assigns the message "Error, too many failed logins" if the primary search value| eval annotation_label = case (count>100 , "Error - too many failed logins", count=0 , "Suspicious - no failed logins" )countis passed to the annotation search and is greater than 100 and a different message, "Suspicious - no failed logins", when the value forcountis equal to 0. You can assign multiple messages to different scenarios depending on what you want an annotation event to express. - Color your annotations (optional).
You can select colors for annotation events using their hexadecimal notation. The color you specify in your annotation search is the dashed line, marker, and flag background. For example, to assign a red color to the first annotation condition and a yellow color to the second, you can add the following search.| eval annotation_color = case (count>100 , "#FF0000", count=0 , "#FFFF00" )
Annotation example
The following example shows a primary data source and a mock search-based annotation that overlays events on the line visualization. The search used to create the annotation in the example is completely independent of the primary search. It is meant to display the general workflow of adding an annotation data source to a line visualization.
Though the search creates the mock data, the results show that the returned data will be formatted correctly to use with the area visualization search. You can cut and paste the following search to see a table with similar results.
| makeresults count=15
| streamstats count
| eval _time=_time-(count*86400)
| eval value=random()%100
| fields _time value
The following dashboard definition shows how the visualization stanza includes the annotation data source and the primary data source. The properties for the annotation, such as messages or color specifications, are set in the options section.
{
  "visualizations": {
    "viz_7PXKfdSe": {
      "type": "splunk.area",
      "dataSources": {
        "primary": "ds_Search_1",
        "annotation": "ds_annotation_markers"
      },
      "options": {
        "annotationX": "> annotation | seriesByIndex(0)",
        "annotationLabel": "> annotation | seriesByIndex(1)",
        "annotationColor": "> annotation | seriesByIndex(2)"
      }
    }
  },
  "dataSources": {
    "ds_Search_1": {
      "type": "ds.search",
      "options": {
        "query": "| makeresults count=15\n| streamstats count\n| eval _time=_time-(count*86400)\n| eval value=random()%100\n| fields _time value"
      },
      "name": "Search_1"
    },
    "ds_annotation_markers": {
      "type": "ds.search",
      "options": {
        "query": "| makeresults count=3\n| streamstats count\n| eval _time=_time-(count*86400*3)\n| eval score = random()%3 +1\n| eval status = case(score=1,\"server error detected\", score=2, \"unknown user access\", score=3, \"status cleared\")\n| eval color = case(score=1,\"#f44271\", score=2, \"#f4a941\", score=3, \"#41f49a\")\n| table _time status color"
      },
      "name": "ds_annotation_markers"
    }
  },
  "defaults": {
    "dataSources": {
      "ds.search": {
        "options": {
          "queryParameters": {
            "latest": "$global_time.latest$",
            "earliest": "$global_time.earliest$"
          }
        }
      }
    }
  },
  "inputs": {
    "input_global_trp": {
      "type": "input.timerange",
      "options": {
        "token": "global_time",
        "defaultValue": "0,"
      },
      "title": "Global Time Range"
    }
  },
  "layout": {
    "type": "absolute",
    "options": {
      "display": "auto-scale"
    },
    "structure": [
      {
        "item": "viz_7PXKfdSe",
        "type": "block",
        "position": {
          "x": 0,
          "y": 0,
          "w": 940,
          "h": 450
        }
      }
    ],
    "globalInputs": [
      "input_global_trp"
    ]
  },
  "description": "",
  "title": "Area chart with annotations"
}
Visualization properties for event annotations
The following table lists the properties defined in the visualization options section. The annotation search generates the settings for the labels and colors.
| Field name | Type | Required | Description |
|---|---|---|---|
| annotationX | [time | number | string] | Yes | Specify the value or field name applied to the event annotation on the x-axis. For example: "annotationX": "> annotation | seriesByIndex(0)".
|
| annotationLabel | string | No | The message that is displayed in the annotation label. For example: "annotationLabel": "> annotation | seriesByIndex(1)".
|
| annotationColor | string | No | Use this field to assign a color to an annotation event. Colors must be specified using hex codes, for example: "annotationColor": "> annotation | seriesByIndex(2)".
|
| Use mock data with ds.test | Data source options and properties |
This documentation applies to the following versions of Splunk® Enterprise: 9.0.0, 9.0.1, 9.0.2, 9.0.3, 9.0.4, 9.0.5, 9.0.6, 9.0.7, 9.0.8, 9.0.9, 9.0.10, 9.1.0, 9.1.1, 9.1.2, 9.1.3, 9.1.4, 9.1.5, 9.1.6, 9.1.7, 9.1.8, 9.1.9, 9.2.0, 9.2.1, 9.2.2, 9.2.3, 9.2.4, 9.2.5, 9.2.6, 9.3.0, 9.3.1, 9.3.2, 9.3.3, 9.3.4


 Download manual
Feedback submitted, thanks!