Part 1: Configure data sources for the Splunk Dashboard Studio tutorial
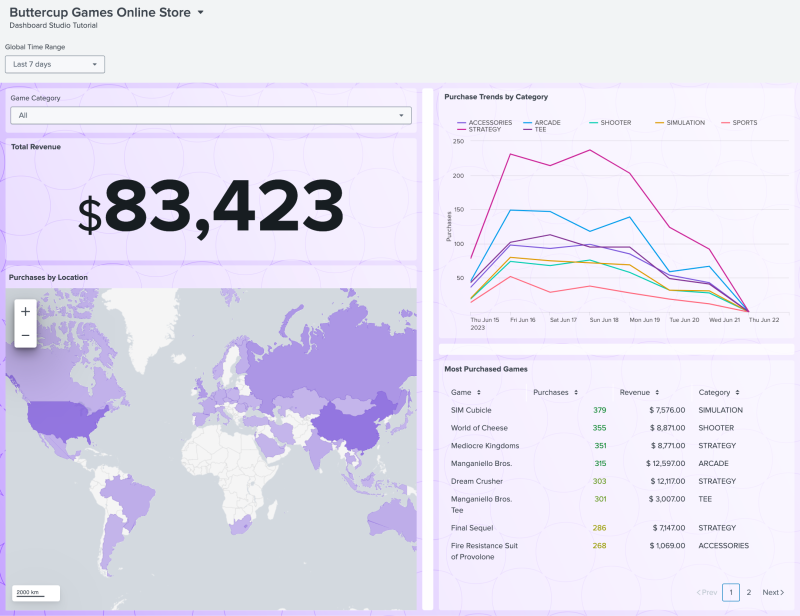
When you want to create a dashboard in Splunk Dashboard Studio, it's good practice to sketch out your dashboard before you begin building. Planning out your dashboard helps to organize your ideas and direct your design process. You can use the following image as a reference for this tutorial while building the Buttercup Games dashboard.
Tutorial prerequisites: Upload and configure the tutorial data
The Dashboard Studio tutorial relies on automated lookups. Before proceeding to Part 2, complete Part 2: Uploading the tutorial data and Part 5: Enabling field lookups in the Search Tutorial manual.
These prerequisites will take you up to ten minutes to complete.
If you do not upload the tutorial data and configure the field lookups, the searches in the Dashboard Studio tutorial will not produce the correct results.
Next step
You've completed Part 1 of the Splunk Dashboard Studio tutorial. Now, your data is ready to use in a dashboard. Next, open a new dashboard in Splunk Dashboard Studio and get acquainted with the editors. Continue to Part 2: Create a dashboard.
| About the Splunk Dashboard Studio tutorial | Part 2: Create a dashboard |
This documentation applies to the following versions of Splunk® Enterprise: 9.1.3, 9.1.4, 9.1.5, 9.1.6, 9.1.7, 9.1.8, 9.1.9, 9.2.1, 9.2.2, 9.2.3, 9.2.4, 9.2.5, 9.2.6, 9.3.0, 9.3.1, 9.3.2, 9.3.3, 9.3.4, 9.4.0, 9.4.1, 9.4.2

 Download manual
Feedback submitted, thanks!