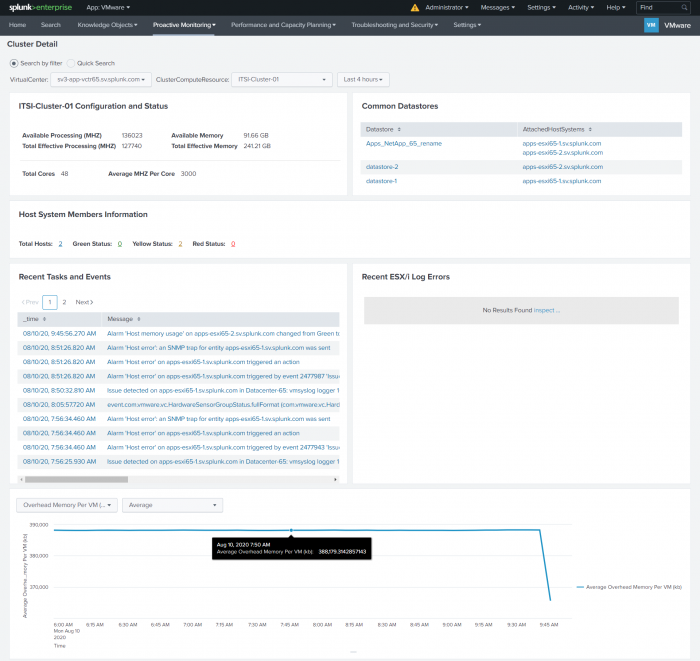
Cluster Detail
On this dashboard you can see the details for a specific cluster over the time range selected.
You can:
- Get a quick view of the state of the hosts in the cluster.
- Identify the root cause of issues in the cluster.
- Check how the cluster performs for key performance metrics.
Cluster Configuration and Status
On this panel get basic configuration information about the state of the cluster. You can see:
- The status of the cluster.
- The available and total processing power (in MHZ) for the cluster.
- The available and total memory (in MB) for the cluster.
- The total number of cores assigned to the cluster and the processing power of each (in MHZ).
Connected Datastores
Look at a list of datastores connected to the host systems in the cluster. Click the datastore name to drill down to the specific details for that datastore, shown on the Datastore Detail dashboard. You get visibility into the file types residing on that datastore. Using this information you can plan your storage requirements for the cluster.
Host System Members Information
Look at high level information about the host systems in the cluster. You can see:
- The total number of host.
- A roll up status of hosts that are in the normal, warning, and critical states for the thresholds defined.
To get more details for each hosts system, click on the value associated with the field. For example, click 23 for Total Hosts to display a table with details for all the host systems in the cluster.
Recent Tasks and Events
Look at recent tasks and events that have occurred on the cluster. This panel lists all completed tasks on the cluster. The task list includes tasks performed on the host systems, for example, you can see alarms that activate when there is a change status for a resource on a host system.
Use this information to investigate the root cause of problems in your cluster. You can isolate problems down to the task that caused it.
Recent ESX/i Log Errors
Look at the log files generated by VMware ESXi hosts in the cluster. ESXi host logs are written to the file system and provide information about system operational events.You can examine the log files in detail drilling down to system events that can identify particular issues in your environment.
Chart of performance data for a cluster
Look at this chart to see the performance of the cluster for a specific performance data type.
Filter your result by selecting a performance metric and then by selecting the statistical operation on the data.
| Host System Detail | Datastore Detail |
This documentation applies to the following versions of Splunk® App for VMware (EOL): 4.0.4

 Download manual
Feedback submitted, thanks!