vCenter Log Browser
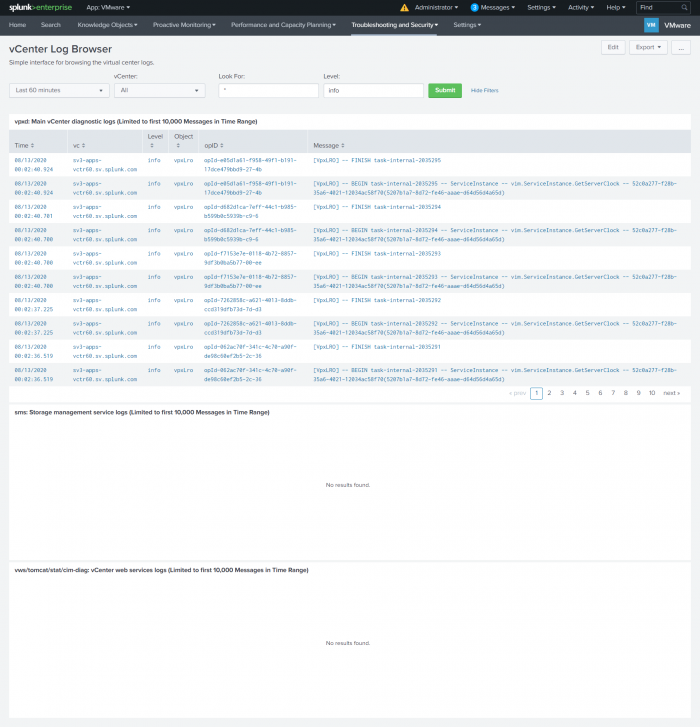
The vCenter Log Browser is a quick and easy way to look at vCenter server logs.
You can browse the following log data:
- Main vCenter diagnostic logs (vpxd).
- Storage management service logs (sms logs).
- vCenter web services logs (vws/tomcat/stat/cim-diag).
For this dashboard to work correctly, you must have vclog data set up to forward to the Splunk App for VMware. See Configure Splunk Add-on for VMware Metrics to collect vCenter Server log data in the Splunk Add-on for VMWare Metrics manual for detailed instructions.
Use the drop-down lists on the dashboard to filter your search results. The drop-down lists are explain in the table below.
| Field | Description |
|---|---|
| Time range | The time range over which events are reported. |
| vCenter | A list of vCenter servers from which you are collecting syslog data. The default value is All. |
| Look for | Enter the term that you want to specifically search for in the logs. |
| Level | A logging level. This can be DEBUG, INFO, WARN, ERROR, or FATAL. The default is ERROR. |
The following source types must be present for the data to populate the panels:
| Panel | Source type |
|---|---|
| vpxd | vmware:vclog:vpxd
|
| sms | vmware:vclog:sms
|
| vws/tomcat/stat/cim-diag | vmware:vclog:vws or vmware:vclog:stats or vmware:vclog:cim-diag or vmware:vclog:vim-tomcat-shared or vmware:vclog:tomcat
|
| ESXi Log Browser | ESXi Hosts Task Overview |
This documentation applies to the following versions of Splunk® App for VMware (EOL): 4.0.4

 Download manual
Feedback submitted, thanks!