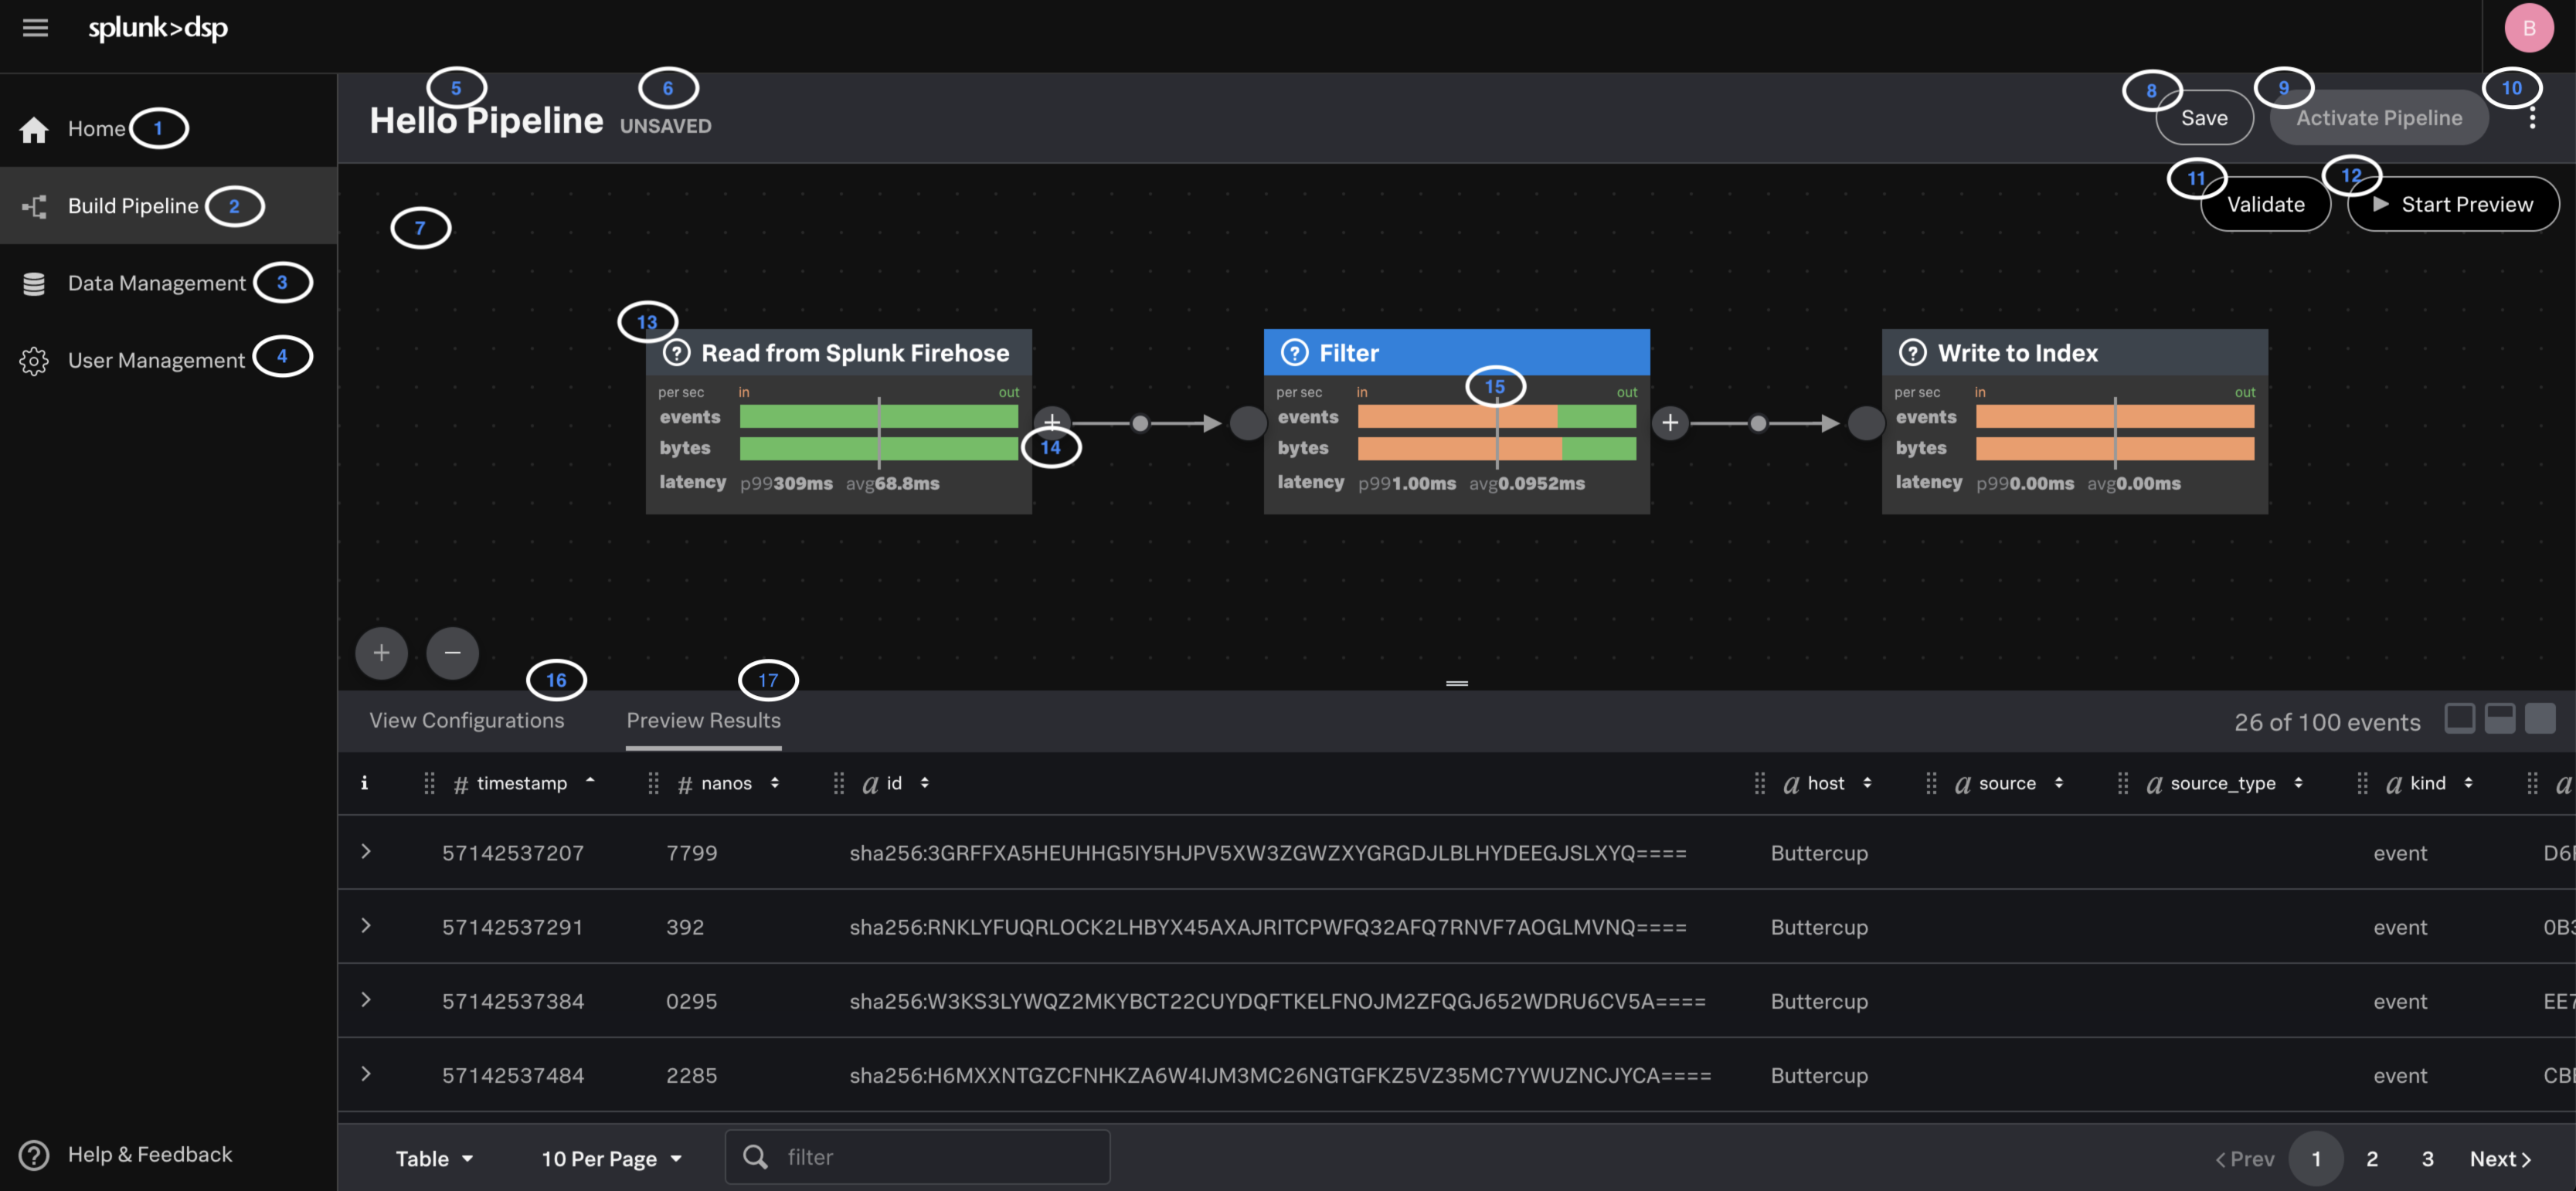
This topic describes the UI view of the Splunk Data Stream Processor (DSP):
| Number | Element | Description |
|---|---|---|
| 1 | Home | The Data Stream Processor homepage. |
| 2 | Build Pipeline | Create a new pipeline by selecting either a source function to read data from or a pre-configured template. |
| 3 | Data Management | Navigate to a list of all pipelines, connections, and templates in the tenant. |
| 4 | User Management | Manage users and admins in your tenant. |
| 5 | Pipeline name | The name of your pipeline. |
| 6 | Pipeline state | The state of your pipeline. For a list of available states and what they mean, see Check the status of a pipeline. |
| 7 | Pipeline canvas | The canvas view of your pipeline. |
| 8 | Save | Save your pipeline. |
| 9 | Activate Pipeline | Activate your pipeline. |
| 10 | Other options | Additional options for your pipeline. You can update your pipeline metadata, save your pipeline with a different name, revert your pipeline to a previous version, deactivate the active version of your pipeline, and delete your pipeline. |
| 11 | Validate | Click to see if your functions are configured properly. |
| 12 | Start Preview | Click to preview data. See Monitor your pipeline with data preview. |
| 13 | Function | The basic building block of a pipeline. |
| 14 | Add a function | Add a function to your pipeline. |
| 15 | Function metrics | Shows the events in and out of your function. You can use these metrics to quickly scan if your records are making it through your pipeline or to check the performance of your pipeline. |
| 16 | View Configurations | The configuration panel of your function. |
| 17 | Preview Results | View the sample events that are sent at each function. |
| Get data in to the Splunk Data Stream Processor | Create a pipeline using the Data Stream Processor UI |
This documentation applies to the following versions of Splunk® Data Stream Processor: 1.0.0

 Download manual
Feedback submitted, thanks!