Normalize data from multiple sources using Splunk Intelligence Management
The data processing layer in Splunk Intelligence Management processes data and improves data quality by eliminating outdated or incorrect elements. You can normalize data from multiple sources into a single data model and schema, regardless of the original structures. Therefore, using Splunk Intelligence Management provides the highest fidelity intelligence in structured outputs such as JSON, which support automated actions in your security workflows.
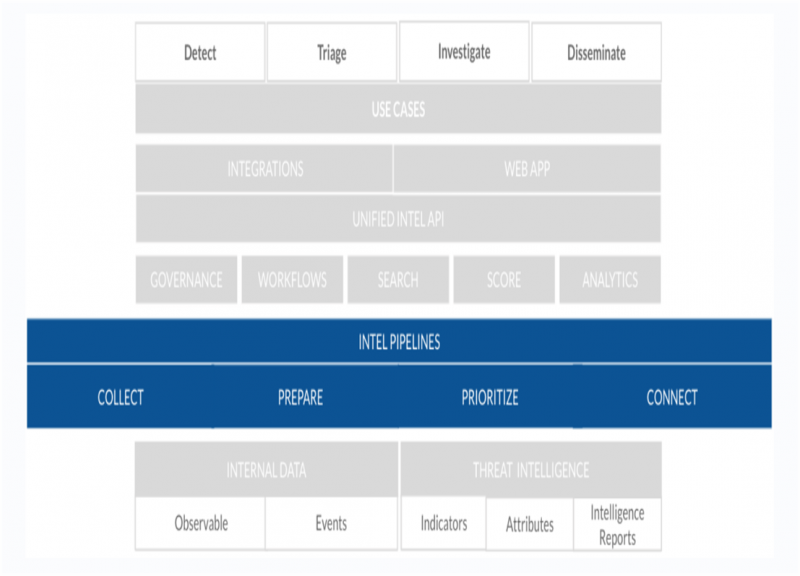
The following figure indicates the various components of the data processing layer within the multilayered architecture of Splunk Intelligence Management:
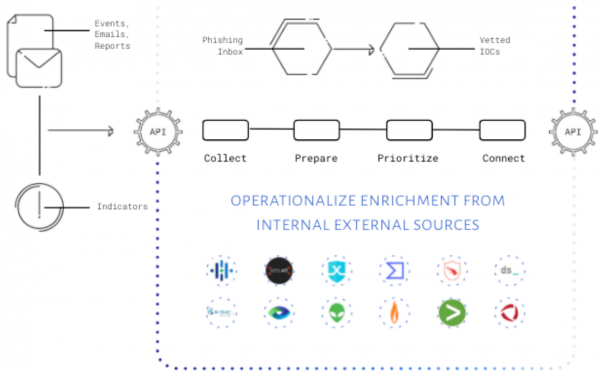
When you send data into Splunk Intelligence Management, the intelligence pipeline extracts and cleans the observables and enriches them with the intelligence sources. Intelligence pipelines automate data-wrangling so that your team can focus on analysis and decision-making, instead of extracting, transforming, and loading your data.
The following figure indicates the workflow within the data processing layer in Splunk Intelligence Management:
To learn more about the multilayer architecture of Splunk Intelligence Management, see How the multilayered architecture of Splunk Intelligence Management works
Collect internal events and intelligence sources
The intelligence pipeline process begins by importing internal events and intelligence sources. Splunk Intelligence Management parses observables from both structured data such as JSON, XML and unstructured data such as emails, text documents.
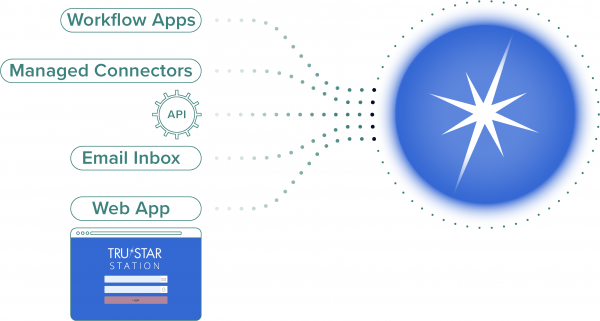
You can send this data to Splunk Intelligence Management using any of the following methods:
- Workflow applications
- Managed connectors
- Email submissions
- Custom scripts using the Unified API for Splunk Intelligence Management and Python SDK
- Splunk Intelligence Management web app that allows bulk uploads using JSON or .CSV formats
The following figure indicates the multiple ways in which you can send data to Splunk Intelligence Management:

Prepare the data and extract observables for further processing
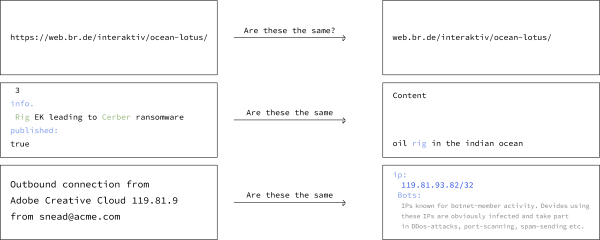
After the intelligence pipeline collects data, it uses machine learning (ML) to automatically parse the information and extract more than a dozen types of observables for further processing.
The following figure indicates how the intelligence pipeline automatically cleans up the data to make the observables comparable across all the intelligence sources:
Prioritize and normalize scores to add context to data
To determine the impact of an observable, Splunk Intelligence Management queries premium intelligence and open sources for matches with that observable. These queries return context such as scores and attributes.
Each intelligence source uses a different scoring system that makes it hard to compare across sources. For example, one source might use 1-10 for severity and another source might use text labels such as Benign or Malicious.
The intelligence pipeline normalizes the different scores using a conversion table so that all scores are comparable across different intelligence sources. The sum of all the normalized scores is the indicator's priority score.
The following figure provides an example of a URL that exists in several sources. Splunk Intelligence Management normalizes each score and associated attributes and provides the prioritized score for the URL Indicator:
Now, the observable becomes an indicator because now it has context such as scores, sources, and other information that is useful for triage and investigation.
The final step in the prioritization process is to store the indicator and its context data in a Splunk Intelligence Management enclave, where it connects to your security processes.
The output of the intelligence pipelines in Splunk Intelligence Management include enriched data, prioritized indicators, and intelligence reports that you can share and connect across tools, teams and communities through different capabilities.
You can submit events for prioritization within Splunk Intelligence Management or you can run similar processing for your intelligence feeds by pulling only the highest priority indicators into your connected tools using the Splunk Intelligence Management API.
The following figure indicates the highest priority indicators that get pulled into connected tools using the Splunk Intelligence Management API:

See also
| Add intelligence to improve data quality using Splunk Intelligence Management | Unify security operations using the capabilities of Splunk Intelligence Management |
This documentation applies to the following versions of Splunk® Intelligence Management (Legacy): current


 Download manual
Feedback submitted, thanks!