Splunk® Enterprise

Splunk Dashboard Studio

Splunk Enterprise version 9.0 will no longer be supported as of June 14, 2024. See the Splunk Software Support Policy for details. For information about upgrading to a supported version, see How to upgrade Splunk Enterprise.

Use mock data with ds.test

The ds.test data source is used for sample data.

ds.test data sources can only be created in the source editor

You create column events and field values manually. The column and field options order are unimportant, but you must have the same number of column values as field names. ds.test is commonly structured similarly to this data source that visualizes monthly sales across multiple geographical regions.

"ds_MonthlySales": {
            "name": "ds_MonthlySales",
            "type": "ds.test",
            "options": {
                "data": {
                    "fields": [
                        {
                            "name": "month"
                        },
                        {
                            "name": "sales - americas"
                        },
                        {
                            "name": "sales - europe"
                        },
                        {
                            "name": "sales - asia"
                        },
                        {
                            "name": "sales - africa"
                        }
                    ],
                    "columns": [
                        [
                            "Jan",
                            "Feb",
                            "Mar",
                            "Apr",
                            "May",
                            "Jun",
                            "Jul",
                            "Aug",
                            "Sep",
                            "Oct",
                            "Nov",
                            "Dec"
                        ],
                        [
                            36821,
                            28683,
                            46253,
                            26723,
                            35745,
                            75265,
                            25255,
                            27467,
                            78267,
                            26581,
                            125252,
                            156212
                        ],
                        [
                            6821,
                            8683,
                            6253,
                            6723,
                            5745,
                            5265,
                            5255,
                            7467,
                            8267,
                            6581,
                            25252,
                            56212
                        ],
                        [
                            3621,
                            2683,
                            4623,
                            2623,
                            3745,
                            7565,
                            2525,
                            2747,
                            7867,
                            2581,
                            12522,
                            15612
                        ],
                        [
                            3682,
                            2863,
                            4653,
                            2723,
                            5745,
                            7526,
                            2525,
                            2767,
                            7267,
                            6581,
                            1252,
                            6212
                        ]
                    ]
                }
            }
        }

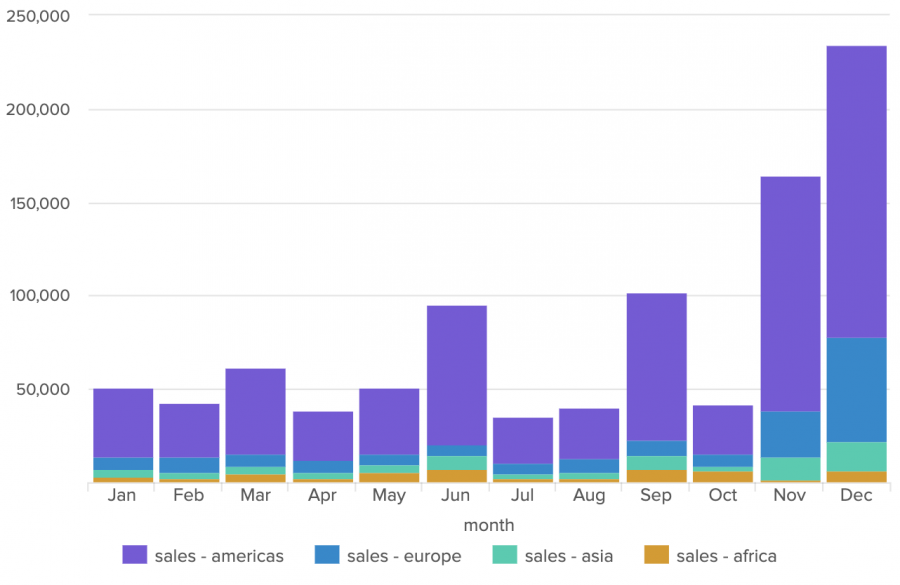
When combined with visual configurations for a column chart, the data source helps illustrate the progression of monthly sales in each region over one year.

A column chart using the ds.test data source to illustrate monthly sales over one year.

Last modified on 01 July, 2021
Use reports and saved searches with ds.savedSearch   Add secondary data sources to your visualization

This documentation applies to the following versions of Splunk® Enterprise: 8.2.1, 8.2.2, 8.2.3, 8.2.4, 8.2.5, 8.2.6, 8.2.7, 8.2.8, 8.2.9, 8.2.10, 8.2.11, 8.2.12, 9.0.0, 9.0.1, 9.0.2, 9.0.3, 9.0.4, 9.0.5, 9.0.6, 9.0.7, 9.0.8, 9.0.9, 9.0.10, 9.1.0, 9.1.1, 9.1.2, 9.1.3, 9.1.4, 9.1.5, 9.1.6, 9.2.0, 9.2.1, 9.2.2, 9.2.3, 9.3.0, 9.3.1


Was this topic useful?


You must be logged into splunk.com in order to post comments. Log in now.

Please try to keep this discussion focused on the content covered in this documentation topic. If you have a more general question about Splunk functionality or are experiencing a difficulty with Splunk, consider posting a question to Splunkbase Answers.

0 out of 1000 Characters