Part 11 Polish up your dashboard
You can add an image to your dashboard for an extra creative flair. Let's add the Buttercup mascot provided by Splunk.
- Download the Buttercup mascot image.
- Select the add image icon (
 ) in the editing toolbar.
 - Using the Configuration panel, under Image, locate your Buttercup mascot .png file and upload the image.
- Resize and position the Buttercup mascot between the two top visualizations.
- Using the editing toolbar, add an ellipse by clicking the Add Shape (
 ) button.
 - Adjust the color and opacity of the ellipse.
- In the General section of the configuration panel, set the Fill Opacity to 20.
- In the Coloring section, set the Static Fill to black hexadecimal #000000, and Static Stroke to transparent.
- Resize and position the ellipse beneath the Buttercup mascot for a shadowing effect.
- You can also use the Buttercup mascot's action panel to layer the mascot in front of the ellipse. See Edit mode visualization panel actions.
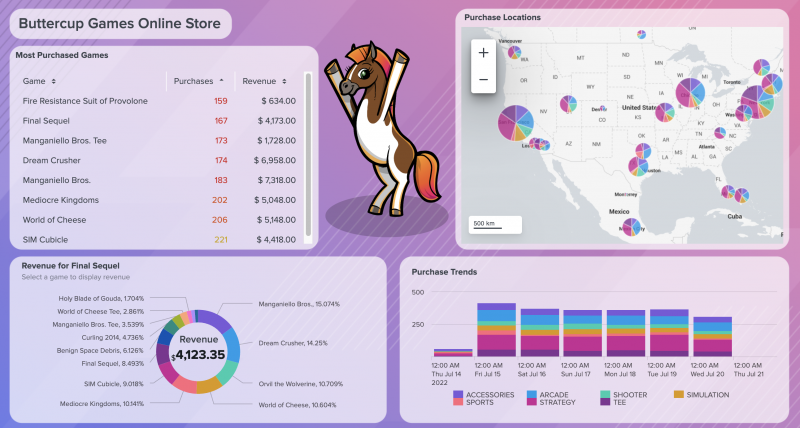
Now your final dashboard, after completing the Splunk Dashboard Studio tutorial, looks similar to this:

You can download a PNG or PDF version of your dashboard, or you can apply view mode settings to your dashboard and allow others to open your dashboard in the Splunk platform.
While in View mode, select Actions and choose to download your dashboard as a PNG or PDF. From the Actions panel, you can also Clone or Delete your dashboard.
Before sending others a link to your dashboard, apply view mode settings to prevent accidental edits from others. See Apply view mode settings for dashboard.
Visit the Dashboard Examples Hub for more resources
The Dashboard Examples Hub provides examples of visualizations, inputs, data sources, defaults, complete dashboards, and various configuration options. Each example lists source code for the data driving the visualization and its options, with each complete dashboard providing the full definition. You can use this code as a reference or copy and paste it into your own dashboard.
Access the Dashboard Examples Hub from the Dashboards page in the Search & Reporting app. From the Dashboards page, select Visit Example Hub under Latest Resources.
| Part 10 Apply customization options with dashboard default settings | What is the visual editor? |
This documentation applies to the following versions of Splunk® Enterprise: 9.0.3, 9.0.4, 9.0.5, 9.0.6, 9.0.7, 9.0.8, 9.0.9, 9.0.10
 Download manual
Feedback submitted, thanks!