Search Experience overview
This guide is for users participating in the Splunk Early Adopter Program who are getting a sneak preview of Search Experience, which is part of a new user-interface (UI) for Splunk Cloud Platform. From the Search Experience you can search data and create charts.
Preview features are provided by Splunk to you "as is" without any warranties, maintenance and support, or service level commitments. Splunk makes this preview feature available in its sole discretion and may discontinue it at any time. Use of preview features is subject to the Splunk General Terms.
Search page overview
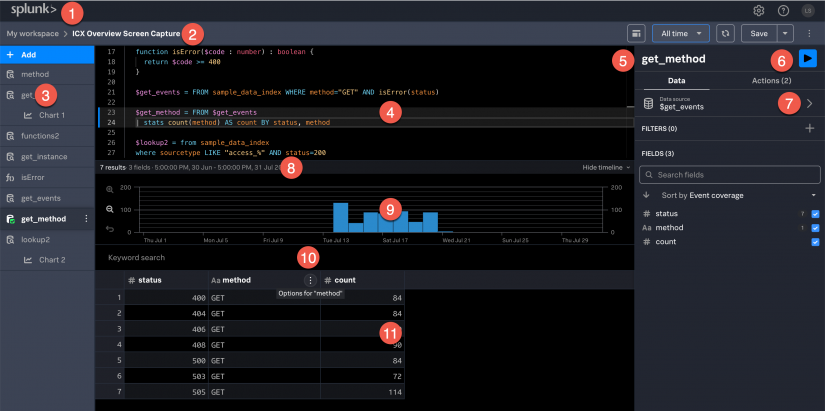
Most of the icons and other elements on the Search page have tool tips that identify the elements. Use the following screen shot and the table below it to become familiar with the main parts of the Search page.
| Number | Element | Description |
|---|---|---|
| 1 | Logo | Click to return to the My workspace page. |
| 2 | Document toolbar | This toolbar displays the name and path of the active module, as well options for changing which panels are displayed, picking a global time range to apply to all searches, the Run All icon, the Save options, and other module options. |
| 3 | Outline panel | Lists the names of the SPL search statements, function statements, and charts in the module. Use to move up and down the SPL Editor display to select and see an item in the outline list. |
| 4 | SPL Editor | The panel that displays the commands, functions, and other components in your SPL statements. Click next to a line number to collapse a statement. |
| 5 | Selected statement | The name of the selected, or active, statement. The panel provides information about the data and actions that you can apply to the statement. |
| 6 | Run button | Click to run the active search statement. You can also use a keyboard shortcut to run the statement. On Linux or Windows use Ctrl + Enter. On MacOS use Command + Enter.
|
| 7 | Dataset list | Click the drop-down to display a list of datasets that you have access to. |
| 8 | Search status information | Displays the number of search results and the number of fields returned from a search. |
| 9 | Timeline | Displays information about the data in a dataset. |
| 10 | Field options menu | Shows a list of actions that you can apply to the selected field, including sorting and filtering the field. |
| 11 | Search results panel | Shows the search results for the active search statement. |
Start searching
To start a new module, you can open the Search Experience directly by selecting Search from the navigation panel or by creating a new module in either the My workspace or Shared workspaces areas.
In the Search Experience, you can use either point-and-click actions to create and run searches, or you can search using SPL2.
In addition, there are sample modules that you can install to help you learn SPL2. See Sample modules.
See also
- Related information
- New terms and concepts
- What is SPL2?
- Shared workspaces
- Known issues
| Install and refresh the sample data | Search using point-and-click |
This documentation applies to the following versions of Splunk Cloud Platform™: search2preview

 Download manual
Feedback submitted, thanks!