Capacity Forecasting
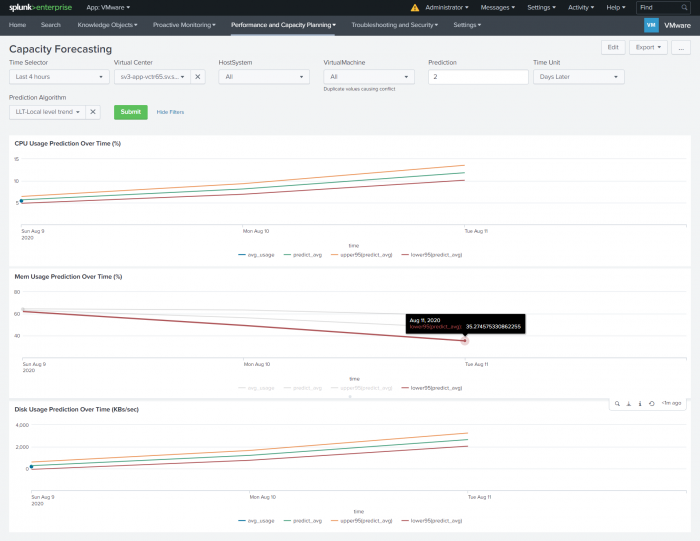
Use capacity forecasting to predict resource usage for different entities in your environment. Predicted results are based on historical values. Using these predictions you can optimize your environment for peak performance and be prepared, in advance, to handle unexpected usage periods.
Using the Capacity Forecasting dashboard, you can:
- Predict cpu usage over a specified time.
- Predict memory usage over time.
- Predict disk usage over time.
Use the drop-down lists to filter your selection for charting predicted resource usage. You can:
- Select a time range for the search using the Time Selector.
- Select a specific virtual center in your environment.
- Select all host systems managed by the virtual center or select a specific host system.
- Select all virtual machines or select a specific virtual machine.
- Set a prediction time. A value of "0" indicates current time. A value of "1" indicates that you want to predict resource usage for 1 "time unit" from now.
- Select a time unit, for example, minutes, days, weeks, or months into the future.
- Select a forecasting algorithm. The prediction algorithms are:
- LLP-Seasonal local level - This is a univariate model with seasonality. The periodicity of the time series is automatically computed. It requires the minimum number of data points to be twice the period.
- LL-Local level - This is a univariate model with no trends and no seasonality. It requires a minimum of 2 data points.
- LLT-Local level trend - This is a univariate model with trend but no seasonality. It requires a minimum of 3 data points.
For more information on the forecasting algorithms used, see "Predict" in the Splunk Enterprise Search Reference manual.
Capacity Forecasting Panel Description
The Capacity Forecasting dashboard charts predicted usage of a resource (cpu, memory, disk).
In each of the charts on this dashboard, the lower and upper confidence interval parameters default to lower95 and upper95. This specifies a confidence interval where 95% of the predictions are expected to fall.
The vmw:perf:* source type must be present for the panels to populate.
| Panel | Description |
|---|---|
| CPU Usage Prediction over Time (%) | The chart displays predicted cpu usage for a host system, or all of the host systems in a virtual center over the time range specified.
CPU usage prediction is calculated as a percent value using the p_average_cpu_usage_percent metric. |
| Mem Usage Prediction over Time (%) | The chart displays predicted memory usage for a host system, or all of the host systems in a virtual center over the time range specified.
Memory usage prediction is calculated as a percent value using the p_average_mem_usage_percent metric. |
| Disk Usage Prediction over Time (KBs/sec) | The chart displays predicted disk usage for a virtual machine or all the virtual machines in a virtual center over the time range specified.
Disk Usage Prediction is calculated in KB/sec using the p_average_disk_usage_kiloBytesPerSecond metric. |
| Capacity Planning for Clusters - Memory Headroom | Virtual Machine Snapshots |
This documentation applies to the following versions of Splunk® App for VMware (EOL): 4.0.4

 Download manual
Feedback submitted, thanks!