Capacity Planning for Clusters - CPU Headroom
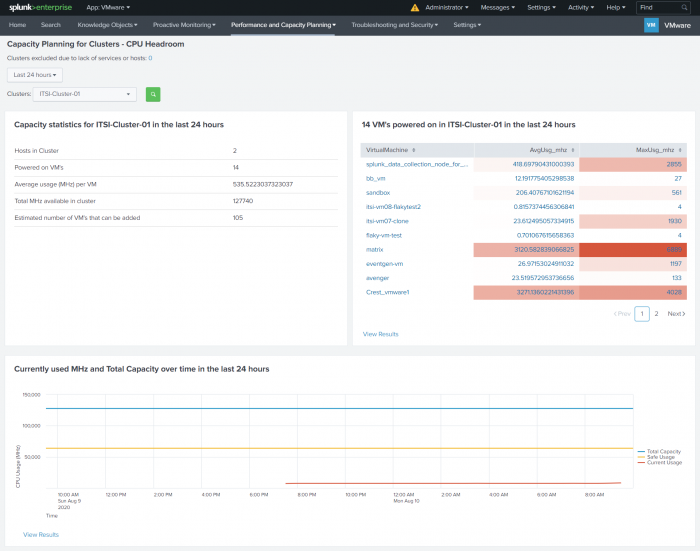
Use this dashboard to get an estimate for the number of virtual machines that you can add to the cluster based on current cpu consumption (of the ESXi hosts) and total cpu capacity allocated to virtual machines in the cluster. This dashboard reports only on powered on virtual machines in the cluster.
The Capacity Planning for Clusters - CPU Headroom dashboard displays:
- Capacity statistics for a cluster.
- A list of powered on virtual machines showing their cpu usage in the cluster.
- A chart showing current cpu usage, safe cpu usage, and total cpu capacity for the cluster.
You can view a list of clusters excluded due to lack of hosts or services. These are clusters that do not support cluster services and that contain less than two hosts.
To display details for a specific cluster, select a time range and the cluster name from the Cluster drop-down list. Details for the cluster are displayed in the panels.
Capacity statistic
In the Capacity statistics panel you can see:
- The number of hosts in the cluster
- The number of powered on virtual machines
- Average CPU usage in (MHz) per virtual machine.
- Total CPU usage MHz available in cluster
- Estimated number of virtual machines that can be added to the cluster
Powered on virtual machines in the cluster
A table displays the powered on virtual machines in the cluster and the average and maximum cpu usage (in MHZ) for each virtual machine.
Currently used (MHz) and Total Capacity
A chart displays the total capacity of the cluster, the current cpu usage of the cluster, and safe usage over the time period specified.
Metrics used
The following metrics are used to calculate cpu utilization:
- cpu usage for the cluster is calculated based on p_average_clusterServices_effectivecpu_megaHertz.
- Average cpu usage (MHz) is calculated based on p_average_cpu_usagemhz_megaHertz.
- Maximum cpu usage (MHz) is calculated based on p_maximum_cpu_usagemhz_megaHertz.
- Minimum cpu usage (MHz) is calculated based on p_minimum_cpu_usagemhz_megaHertz
Searches that populate the dashboard
The following searches populate the panels in the dashboards:
- d_capacity_planning_cluster_cpu
- d_capacity_planning_clusters_cpu_chart
- d_cluster_detail_AvgCpuPerVM_mhz
- d_cluster_detail_AvgCpuUsg_pct
- d_cluster_detail_TotUsg_mhz
| Capacity Planning Clusters | Capacity Planning for Clusters - Memory Headroom |
This documentation applies to the following versions of Splunk® App for VMware (EOL): 4.0.4

 Download manual
Feedback submitted, thanks!