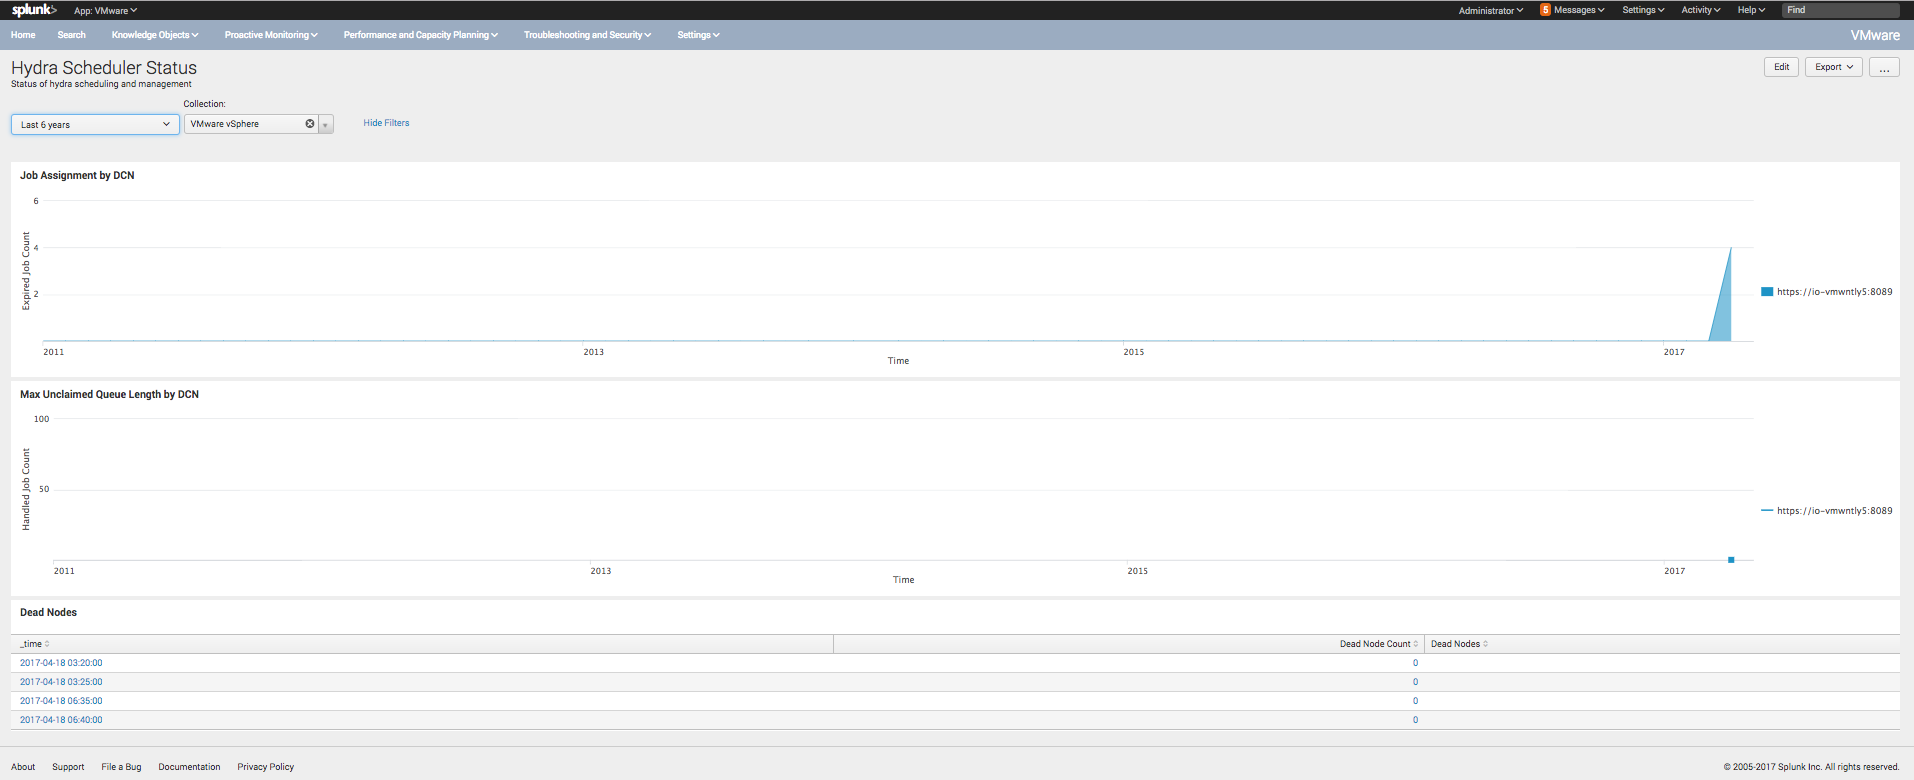
Hydra Scheduler Status
Use the Hydra Scheduler Status page to identify issues related to jobs handled your scheduler. Page can be viewed by following the below link for your Splunk platform deployment. https://<SH>:8000/en-US/app/splunk_for_vmware/hydra_scheduler_status.
Enable data population for this page.
- Navigate to
Splunk_TA_vmware/local/input.conf - Set the
log_leveltoDEBUGfor all enabled worker stanzas. - Save your changes and restart your Splunk platform deployment.
| Dashboard name | Description |
|---|---|
| Job Assignment by DCN | Number of jobs assigned to each DCN versus time. It will populate when DEBUG level is enabled on scheduler. Scheduler logs are required to populate this panel. |
| Max Unclaimed Queue Length by DCN | Number of unclaimed jobs reported by each DCN to Scheduler versus time. It will populate when DEBUG level is enabled on scheduler. Scheduler logs are required to populate this panel. |
| Dead Nodes | List of dead nodes (DCNs) and their count at every 5 minute interval. Scheduler logs are required to populate this panel. |
| Hydra Framework Status | Common use cases |
This documentation applies to the following versions of Splunk® App for VMware (EOL): 4.0.4

 Download manual
Feedback submitted, thanks!