Splunk® App for VMware (EOL)

User Guide

On August 31, 2022, the Splunk App for VMware will reach its end of life. After this date, Splunk will no longer maintain or develop this product. The functionality in this app is migrating to a content pack in Data Integrations. Learn about the Content Pack for VMware Dashboards and Reports.

Performance of Hosts and VMs

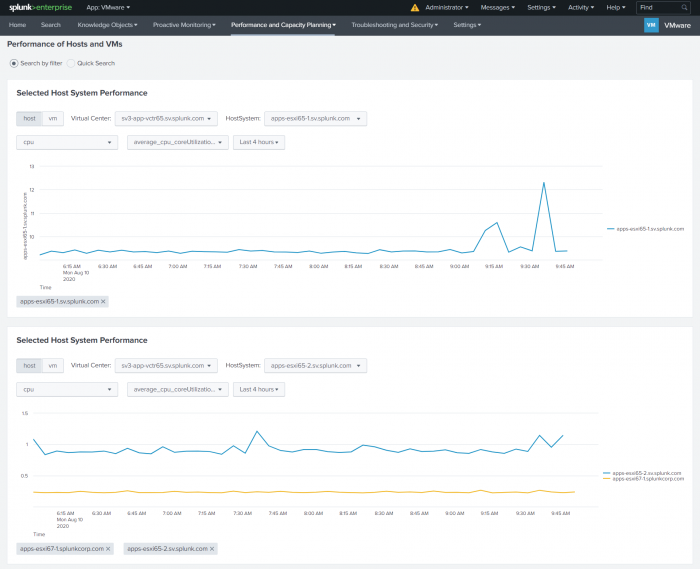
Use this dashboard to visually compare the performance statistics, for hosts and virtual machines, in your VMware vSphere® environment, based on a selected performance metric.

You can compare the performance statistics of:

  • A host on one VMware vCenter Server with another host on the same vCenter Server.
  • Multiple hosts in a vCenter Server with hosts on another vCenter Server.
  • One or more virtual machines with other virtual machines.

Host-vm-perf.png

Panel description

On each of the panels on this dashboard, use the toggle buttons, the search box, and the drop-down lists to set your search criteria. The name of the selected host or virtual machine is displayed in the panel, and a chart shows the performance statistics for that host or virtual machine.

You can chart up to a maximum of 50 hosts or virtual machines and compare the performance statistics for each. To change the default limit, edit the value set for limitSelectionCount in the SOLNSelector module in the host_vm_perf view:

name="limitSelectionCount">50

To clear the chart, click on each of the listed entity names in the panel to remove them.

Field Description
host / vm toggle Use this toggle to select either host or vm.
  • Click host to chart the search results at the host level in your environment.
  • Click vm to chart the search results at the virtual machine level in your environment.
Search box
  • When host is selected, in the search box, enter the name of the host, for example, apps-esx-21. As you type your search, a filtered list of possible matches is displayed. This helps you to search an entity (virtual machine or host system) through virtual center, host, or cluster. To select all the entity matches shown in the results list, use the wildcard character "*" after the "/".
  • When you select vm, enter the name of a virtual machine, for example apps-21vm. A filtered list of predicted virtual machines is displayed as you enter your search. Select a virtual machine from the list. You can chart the performance of any number of virtual machines by making more selections.
Drop-down lists
  • Select a performance metric category from the list provided, for example, cpu.
  • Select a performance metric, for example, average_cpu_usage_percent.
  • Select a time range for the search.
Last modified on 13 April, 2022
Datastore Detail   Capacity Planning Hosts

This documentation applies to the following versions of Splunk® App for VMware (EOL): 4.0.4

Was this topic useful?


You must be logged into splunk.com in order to post comments. Log in now.

Please try to keep this discussion focused on the content covered in this documentation topic. If you have a more general question about Splunk functionality or are experiencing a difficulty with Splunk, consider posting a question to Splunkbase Answers.

0 out of 1000 Characters