Alert on Splunk RUM data 🔗
Splunk RUM leverages the Infrastructure Monitoring platform to create detectors and alerts. Configure detectors to alert on your Splunk RUM metrics so that you can monitor and take timely action on alerts associated with your application.
How alerts work in Splunk RUM 🔗
In Splunk RUM for Browser, alerts are triggered on aggregate metrics for the entire application. If you want to create an alert for a page level metric, first create a custom event for the metric, then create an alert for the custom event. To learn more, see Create custom events. If you are new to alerts and detectors, see Introduction to alerts and detectors in Splunk Observability Cloud.
Integrations 🔗
You can use the following methods and integrations to receive alerts from Splunk RUM:
Email notifications
Jira
PagerDuty
ServiceNow
Slack
VictorOps
XMatters
You can also add a link in your message such as a link to a runbook or other troubleshooting information in your organization.
Data retention 🔗
Alerts are triggered based on Infrastructure Monitoring metrics. Metrics are stored for 13 months. For more, see Data retention in Splunk Observability Cloud.
Types of metrics you can alert on 🔗
You can create alerts on the following kind of metrics. For a comprehensive list of all Splunk RUM metrics, see:
To learn more about web vitals, see https://web.dev/vitals/ in the Google developer documentation.
Category |
Metrics |
|---|---|
Web vitals |
|
Custom events |
|
Page metrics |
|
Endpoint metrics |
|
Alert configuration examples 🔗
Here are a few examples of how you can configure alerts. Set the scope of your alert to either the page or URL level, or the app level which is an aggregate. The following use cases feature examples from Buttercup Industries, a fictitious ecommerce company.
Alert trigger conditions 🔗
RUM alert conditions are designed to reduce noise and provide clear, actionable insights on your data. You can configure the sensitivity of the alert to suit your needs. If you want an alert that is more sensitive to smaller changes, you can reduce the percentage. For example, if you set your sensitivity to 10%, then you’d be alerted when only 10% of the data in the given time frame crosses the threshold you set.
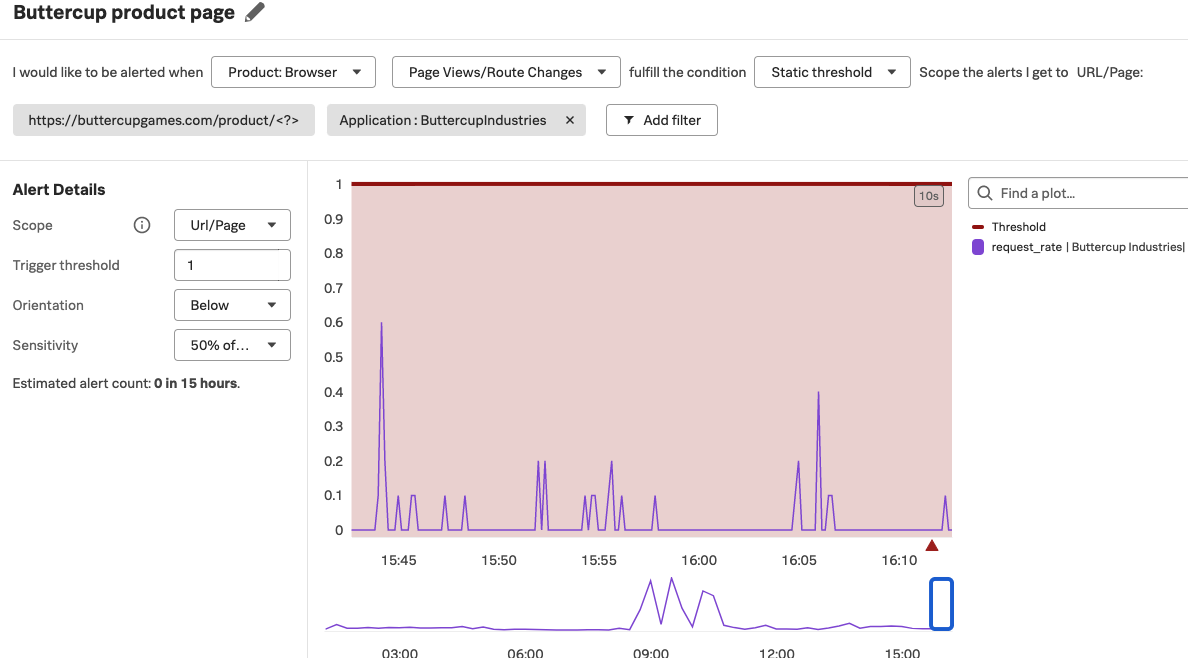
Page level metrics 🔗
To create a page level metric, first create a custom rule to map to the page you want to monitor. See Write custom rules for URL grouping in Splunk RUM to learn how to create a custom rule. For example, suppose you use the pattern https://buttercupgames.com/product/<?> because you want to group by the product type for your online store Buttercup Games. When you create a detector, apply a custom rule by selecting the rule from the list. The following image shows a page level detector for the custom pattern https://buttercupgames.com/product/<?>.
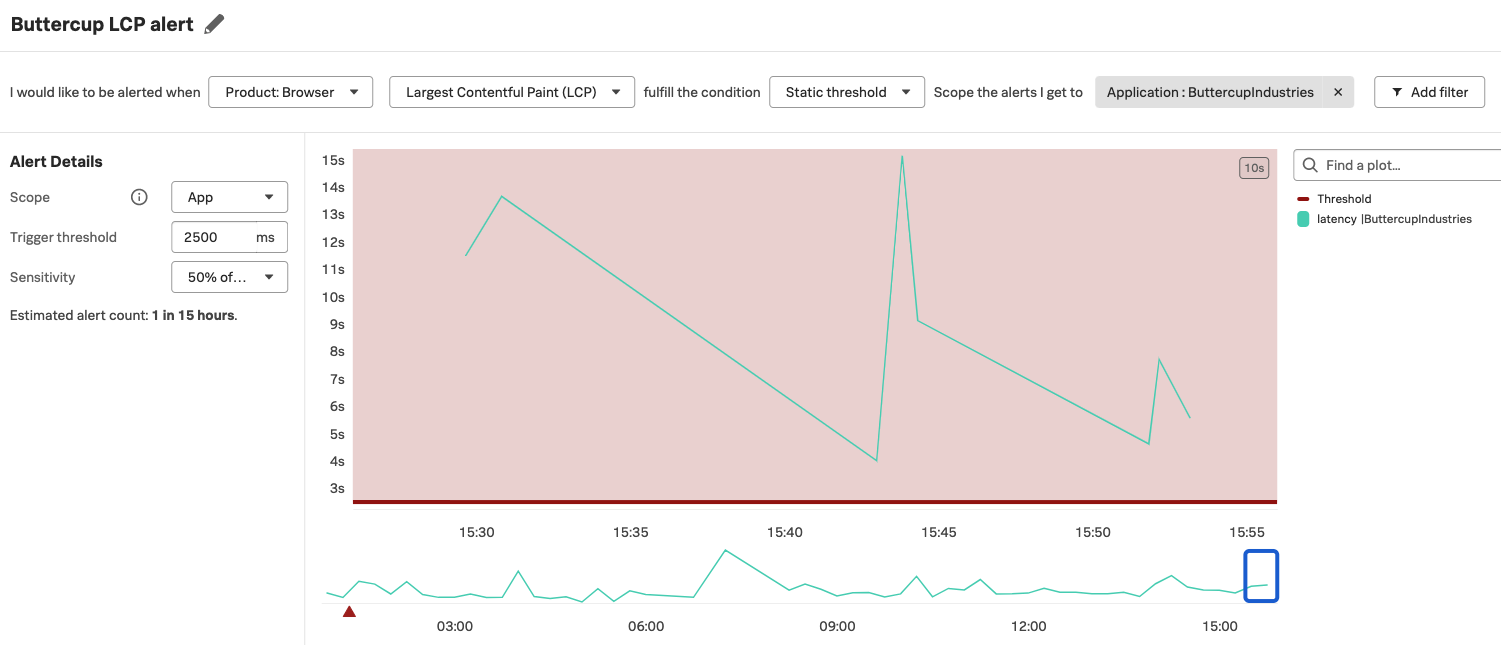
App level metrics 🔗
Web vitals have a standard range that denotes good performance. For example, a largest contentful paint (LCP) metric of more than 2.5 seconds might lead to bad user experience on your application. With Splunk RUM, you can create an alert to notify you when your aggregated LCP is more than 2.5 seconds, send a Slack notification to your team, and link to the runbook with the steps on how to remedy the slow LCP.
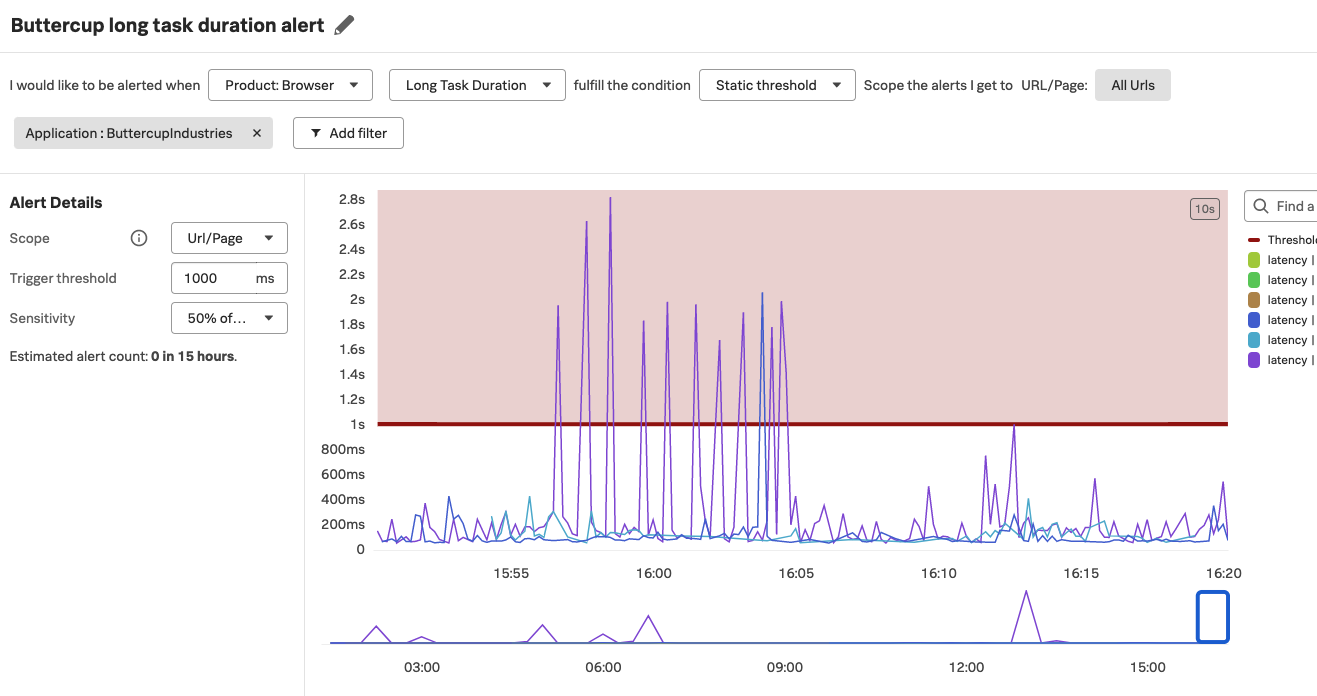
URL level metrics 🔗
The following image shows an example configuration for a URL level metric for long task duration that triggers if 50% of the data points in a five minute window are longer than 1000 milliseconds.
Create a detector 🔗
You can create a detector from either the RUM overview page or from Tag Spotlight.
Follow these steps to create a detector in RUM:
In Splunk RUM, select a metric that is of interest to you to open Tag Spotlight.
Select Create new detector.
Configure your detector:
Name your detector.
Select the metric that is of interest to you and the type of data.
Set the static threshold for your alert.
Select the scope of your alert.
Select the severity of the alert.
Apply a custom rule by selecting the rule from the list under “Scope the alerts I get to URL/Page”.
Share your alert with others by integrating with the tool your team uses to communicate and adding a link to your runbook.
Select Activate.
Create dashboards for your RUM alerts 🔗
You can create dashboards for both web and mobile metrics. To see a list of the metrics available in Splunk RUM, see:
To create charts and dashboard for your RUM alerts and detectors, see:
Link detectors to charts in Alerts, detectors, and SLO.
Dashboards in Splunk Observability Cloud in Dashboards and charts.
View detectors and alerts 🔗
For instructions, see: