Set up Infrastructure Monitoring 🔗
This page provides an overview for sending metrics from common data sources to Splunk Observability Cloud.
An integration is a configurable component of Splunk Observability Cloud that connects Splunk Observability Cloud to a third-party service. Most integrations connect third-party data services, but Splunk Observability Cloud also offers SSO and notification integrations. You can configure integrations in Splunk Observability Cloud to collect metrics from your infrastructure. If you also want to collect logs and traces from your infrastructure and services, see the Get data into Splunk Observability Cloud guide.
Each integration walks you through a step-by-step process to collect supported data types. To configure an integration for any data source, select Navigation menu > Data Management > Available integrations.
The following steps describe how to configure integrations that collect metrics from your infrastructure.
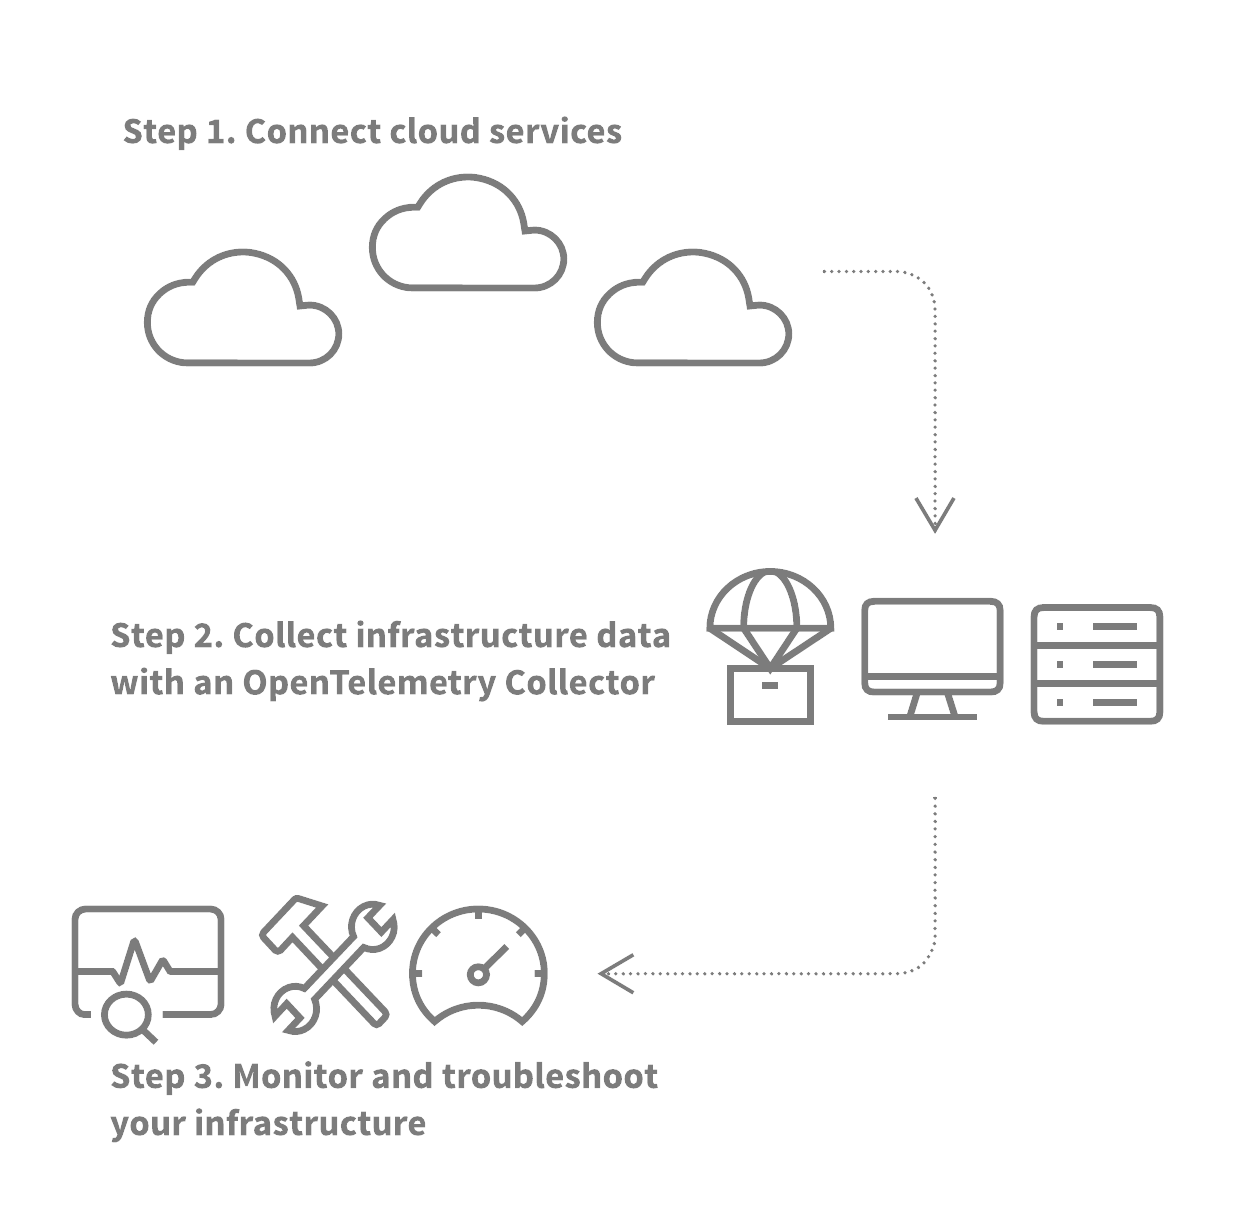
Step 1. Connect cloud services 🔗
Note: You must be an administrator to set up integrations that collect data on your behalf in Splunk Observability Cloud.
Connect Splunk Observability Cloud to your cloud service provider to collect data from supported cloud services in AWS, GCP, or Azure. You do not have to connect to cloud services to monitor hosts or Kubernetes clusters that run in cloud services, but connecting your cloud account is the only way to collect cloud metadata.
If you don’t use cloud services or don’t want Splunk Observability Cloud to collect data or sync metadata from them, skip to the next step.
Splunk Observability Cloud collects both logs and metrics data from AWS accounts. If you plan to collect only metrics from an AWS account, select to only collect data from CloudWatch Metrics.
To connect to a cloud service, select Navigation menu > Data Management > Available integrations and search for the cloud service you want to connect to.
For detailed steps on connecting cloud services to Splunk Observability Cloud, see these pages:
Step 2. Collect infrastructure data with the Splunk Distribution of the OpenTelemetry Collector 🔗
Splunk Observability Cloud supports integrations for Kubernetes, Linux, and Windows. Integrations for these data sources help you deploy a Splunk Distribution of OpenTelemetry Collector to export metrics from hosts and containers to Splunk Observability Cloud.
Using the Splunk Distribution of OpenTelemetry Collector is optional; however, you get higher-resolution data using the Splunk Distribution of OpenTelemetry Collector than from cloud integrations.
To collect metrics from an infrastructure resource, select Navigation menu > Data Management > Available integrations and search for the host type or containerized environment you want to collect metrics from.
See these pages for more information about sending host or container metrics to Splunk Observability Cloud:
Step 3. Monitor and troubleshoot your infrastructure 🔗
In steps 1 and 2, you sent data into Splunk Observability Cloud from supported cloud services, hosts, and containers. This data populates built-in experiences, including the Infrastructure Overview, which you can use to get started with monitoring and troubleshooting your infrastructure.
To view the Infrastructure Overview, select Navigation menu > Infrastructure. From this page, you can view your infrastructure, as described in the following table.
Splunk Observability Cloud also provides metrics and other data for the following host and application monitors.
Category |
Resource |
Description |
|---|---|---|
Public Clouds |
View key metrics and visualize incidents for every supported cloud service. The Infrastructure Overview provides default dashboards for each cloud service. For example, there are separate dashboards for AWS EC2 instances and AWS EBS instances. |
|
Containers |
View key metrics and visualize incidents for your Kubernetes infrastructure at the cluster, node, pod, and container level. |
|
My Data Center |
View key metrics and visualize incidents for every Linux and Windows host you collect data from in Splunk Observability Cloud. |