Docs » Connect to your cloud service provider » Connect to Google Cloud Platform

Connect to Google Cloud Platform 🔗

With a Google Cloud Platform (GCP) integration in Splunk Observability Cloud, you can track your Google Cloud Monitoring metrics and monitor your GCP services in one place. To configure a GCP integration with Splunk Infrastructure Monitoring, check the prerequisites and follow the instructions on this document. You can also use the API to connect to GCP.

For the list of the GCP services available in Splunk Observability Cloud by default, see the list of supported integrations.

Prerequisites

The following pre-requisites apply:

  • You must be an administrator of your Splunk Observability Cloud organization to create a GCP connection.

  • Splunk Observability Cloud supports all GCP regions.

Connect to GCP using the guided setup

Select a role for your GCP service account

If you use GCP’s Project Viewer role, you won’t require any changes to your GCP setup to use Splunk Observability Cloud, and any update will be applied automatically.

If you want to use a more restrictive role than Project Viewer, make sure your selected role has sufficient permissions to connect to Observability Cloud, otherwise you’ll get an error message when trying to connect. Review and activate any missing permissions, or change the role to Project Viewer.

The following table specifies the permissions required for GCP integrations:

Permission

Required?

monitoring.metricDescriptors.list

Yes

monitoring.timeSeries.list

Yes

compute.instances.list

Yes, if the Compute Engine service is activated

compute.machineTypes.list

Yes, if the Compute Engine service is activated

container.clusters.list

Yes, if the Kubernetes (GKE) service is activated

container.nodes.list

Yes, if the Kubernetes (GKE) service is activated

container.pods.list

Yes, if the Kubernetes (GKE) service is activated

monitoring.metricDescriptors.get

Yes

monitoring.metricDescriptors.list

Yes

monitoring.timeSeries.list

Yes

resourcemanager.projects.get

Yes, if you want to sync project metadata (such as labels), or if you need to obtain metrics from monitored projects of a scoping project

serviceusage.services.use

Yes, if you want to activate the use of a quota from the project where metrics are stored

spanner.instances.list

Yes, if the Spanner service is activated

storage.buckets.list

Yes, if the Spanner service is activated

Configure GCP

To configure your GCP service, follow these steps:

  1. In a new window or tab, go to the Google Cloud Platform website, and log into your GCP account.

  2. Open the GCP web console, and select a project you want to monitor.

  3. From the sidebar, select IAM & admin, then Service Accounts.

  4. Go to Create Service Account at the top of the screen, and complete the following fields:

    Field

    Description

    Service account name

    Enter Splunk.

    Service account ID

    This field autofills after you enter Splunk for Service account name.

    Service account description

    Enter the description for your service account.

  5. Select CREATE.

  6. (Optional) Select a role to grant this Service account access to the selected project, then select CONTINUE.

  7. Activate Key type JSON, and select CREATE. A new service account key JSON file is then downloaded to your computer.

  8. In a new window or tab, go to Cloud Resource Manager API , and activate the Cloud Resource Manager API. You need to activate this API so Splunk Infrastructure Monitoring can use it to validate permissions on the service account keys.

Note

To monitor multiple GCP projects, repeat the steps described in this section for each one of the projects.

Start the integration

By default, all supported services are monitored, and any new services added later are also monitored. When you set integration parameters, you can choose to import metrics from a subset of the available services.

  1. Log in to Splunk Observability Cloud.

  2. Open the Google Cloud Platform guided setup . Optionally, you can navigate to the guided setup on your own:

    1. In the navigation menu, select Data Management, then select + Add Integration to open the Integrate Your Data page.

    2. In the integration filter menu, select By Use Case, and select the Monitor Infrastructure use case.

    3. In the Cloud Integrations section, select the Google Cloud Platform tile to open the Google Cloud Platform guided setup.

    4. Go to New Integration.

  3. Enter a name for the new GCP integration, then Add Project.

  4. Next, select Import Service Account Key, and select one or more of the JSON key files that you downloaded from GCP in Configure GCP.

  5. Select Open. You can then see the project IDs corresponding to the service account keys you selected.

  6. To import metrics from only some of the available services, follow these steps:

    • Go to All Services to display a list of the services you can monitor.

    • Select the services you want to monitor, and then Apply.

  7. Select the rate (in seconds) at which you want Splunk Observability Cloud to poll GCP for metric data, with 1 minute as the minimum unit, and 10 minutes as the maximum unit. For example, a value of 300 polls metrics once every 5 minutes.

  8. Optional:

    • List any additional GCP service domain names that you want to monitor, using commas to separate domain names in the Custom Metric Type Domains field.

      • For example, to obtain Apigee metrics, add apigee.googleapis.com.

      • To learn about custom metric type domain syntax, see Custom metric type domain examples in the Splunk developer documentation.

    • If you select Compute Engine as one of the services to monitor, you can enter a comma-separated list of Compute Engine Instance metadata keys to send as properties. These metadata keys are sent as properties named gcp_metadata_<metadata-key>.

    • Select Use quota from the project where metrics are stored to use a quota from the project where metrics are stored. The service account provided for the project needs either the serviceusage.services.use permission, or the Service Usage Consumer role.

Your GCP integration is now complete.

Note

Splunk is not responsible for data availability, and it can take up to several minutes (or longer, depending on your configuration) from the time you connect until you start seeing valid data from your account.

Alternatives to connect to GCP

Integrate GCP using the API 

You can also integrate GCP with Splunk Observability Cloud using the GCP API. See Integrate Google Cloud Platform Monitoring with Splunk Observability Cloud in our developer portal for details.

Connect to GCP using Terraform

To connect using Terraform, see Connect your cloud services using Splunk Terraform.

Install the Splunk Distribution of OpenTelemetry Collector

To take advantage of the full benefits of the Splunk Observability Cloud platform, install the OpenTelemetry Collector.

Track your OpenTelemetry enablement

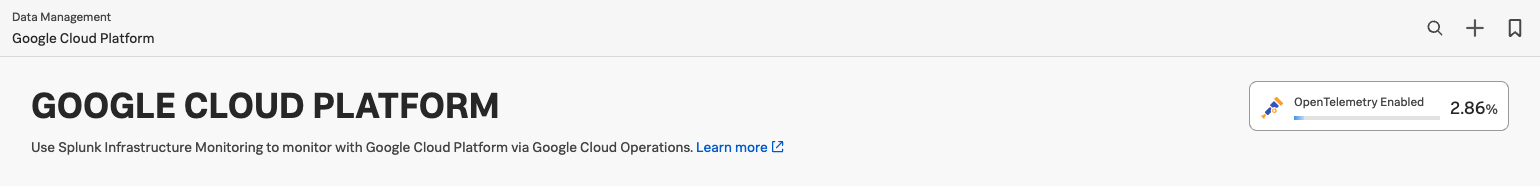
To track the degree of OpenTelemetry enablement in your GCP integrations:

  1. From Splunk Observability Cloud, go to Data Management > Google Cloud Platform.

  2. Select OpenTelemetry Enabled to see whether the OTel Collector is installed on each GCE instance or GKE cluster. This helps you identify the instances that still need to be instrumented.

Amount of GCP entities with the Collector installed.
  1. For OTel Collector instances that are successfully instrumented, you can see which version of the Collector is deployed.

Next steps

To validate your setup, examine the details of your GCP integration as displayed in the list at the end of the setup page.