Docs » Get data into Splunk Observability Cloud

Get data into Splunk Observability Cloud 🔗

Use Splunk Observability Cloud to achieve full-stack observability of all your data sources, including your infrastructure, applications, and user interfaces. Splunk Observability Cloud includes the following products:

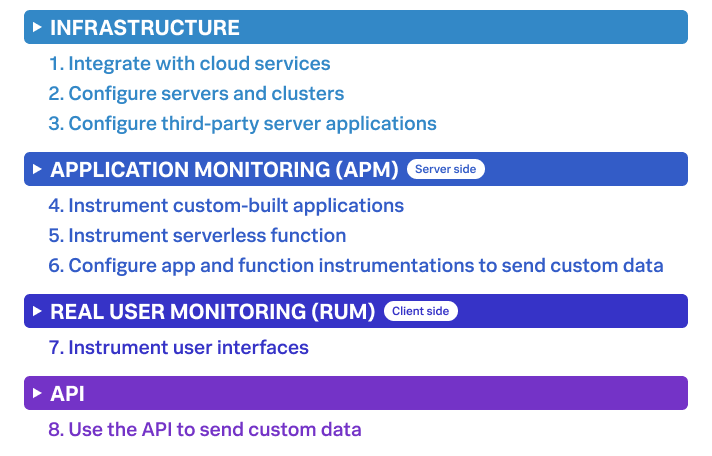
Here’s a high-level overview of your options for getting data from each layer of your stack into the Splunk Observability Cloud product best suited to provide insights about your system.

For standard environments and workflows, perform all the steps described below to get the most out of Splunk Observability Cloud. However, depending on your observability goals and environment, you can choose to perform only a subset of the steps. For example, if you don’t use every Splunk Observability Cloud product, or if you don’t want to collect data from every eligible data source.

Per product integration recommendations 🔗

If you’re not yet implementing full-stack observability as described in the diagram above, and are using only one or a few products, see the table to learn which steps are recommended, optional, or not applicable (n/a) based on your use case.

Step

Infrastructure Monitoring only

APM only

RUM only

Sends logs?

1. Integrate with cloud services

Recommended

n/a

n/a

Yes

2. Install the OpenTelemetry Collector for servers and clusters

Recommended

Recommended

n/a

Yes

3. Configure third-party server apps

Optional

Optional

n/a

Yes

4. Instrument apps and back-end services

Optional

Recommended

n/a

Yes

5. Instrument serverless functions

Optional

Recommended

n/a

No

6. Configure apps and serverless functions to send custom data

n/a

n/a

Recommended

No

7. Instrument user interfaces

Recommended

Recommended

n/a

No

8. Use the API to send custom data

Optional

Optional

n/a

Yes

1. Integrate with cloud services to send metrics and logs 🔗

If you’re using cloud services for your infrastructure, the first step is to integrate these services with Splunk Observability Cloud. Cloud integrations can send metrics and metadata (such as tags, labels and other properties) to Infrastructure Monitoring.

After you’ve integrated with your cloud services, you can access your data in the following locations:

Steps 🔗

For example, you might want to use the guided setup if you are setting up just a few integrations. However, if you are setting up many integrations, such as for different accounts and regions, use the API or Terraform. Note that if you need all of the latest integration features, you might want to use the API because support might not yet be available using Terraform.

2. Install the OpenTelemetry Collector to send server and cluster data 🔗

Install the Splunk Distribution of OpenTelemetry Collector on any hosts or clusters you’re using as a part of your infrastructure, such as servers running in your data center or on a virtual machine running in the cloud to:

After you’ve installed the Collector and configured your servers and clusters, you can access your data in the following locations:

Steps 🔗

One of the benefits of using the Splunk Distribution of OpenTelemetry Collector to send your data to Splunk Observability Cloud is that Related Content, a feature that activates users to seamlessly move between key views in Splunk Observability Cloud, is easier to implement. For more information, see Related Content in Splunk Observability Cloud.

3. Configure third-party server applications to send metrics, logs, and traces 🔗

After you’ve completed step 2. Install the OpenTelemetry Collector to send server and cluster data and installed the Splunk Distribution of OpenTelemetry Collector on your servers (hosts) or in your clusters, configure the Collector’s native receivers or any of these third-party applications, such as Apache, Cassandra, Hadoop, Kafka, and NGINX, to monitor your systems.

After you’ve configured the Collector’s pipelines for your desired server applications, access your data in the following locations:

4. Instrument back-end services and applications to send traces, logs, and metrics 🔗

You can choose to instrument applications that you’ve developed in-house to send data to Splunk Observability Cloud:

  • Traces to APM

  • Logs (events) to Log Observer

  • Metrics to Infrastructure Monitoring (Java only)

After you’ve instrumented your application, you can access your data in the following locations:

Steps 🔗

See the instrumentation documentation for your application language:

Note

If you use the Splunk Distribution of OpenTelemetry Collector to send your data to Splunk Observability Cloud, you can benefit from Related Content, a feature that activates users to seamlessly move between key views in Splunk Observability Cloud. For more information, see Related Content in Splunk Observability Cloud.

5. Instrument serverless functions to send traces and metrics 🔗

You can choose to instrument your serverless functions.

Note: This step is about bringing in built-in metrics and traces. Once you have a chance to familiarize yourself with your data coming in, you can use this same instrumentation to bring in custom data. For more information, see step 7. Configure applications and serverless functions to send custom data.

This integration can send:

  • Traces to APM

  • Metrics to Infrastructure Monitoring

After you’ve instrumented your serverless functions, you can access your data in the following locations:

Steps 🔗

To instrument your AWS Lambda serverless functions, see Instrument serverless functions for Splunk Observability Cloud.

6. Instrument user interfaces to send user sessions 🔗

You can instrument browser and mobile user interfaces to monitor front-end application user experiences, sending your user sessions to RUM to review key metrics and vitals, as well as investigate errors in your spans:

This screenshot shows an example of the Splunk RUM landing page

Steps 🔗

7. Configure applications and serverless functions to send custom data 🔗

Now that you have built-in data from your full stack flowing into Splunk Observability Cloud, assess whether there are custom data points you need to bring in.

For many teams, some of the most meaningful data is custom data because you can define these data points to focus on what is most important to you in your specific environment.

For example, if you run an e-commerce site, you might configure your application to send a custom metric about the number of orders placed. You can then create a detector to receive an alert when the number of orders drops significantly. You might also configure your application to send a custom metric about how long payment processing takes. You can then create a detector to issue alerts when the processing time exceeds a threshold.

You can configure applications to send custom metrics and instrument serverless functions to send custom traces. Access your custom data in the following locations:

Configuration steps for back-end applications 🔗

Use the library for your application language:

Instrument serverless functions 🔗

To instrument your AWS Lambda serverless functions, see Instrument serverless functions for Splunk Observability Cloud.

8. Use the Splunk Observability Cloud API to send custom data 🔗

Now that you have built-in data from your full stack flowing into Splunk Observability Cloud, assess whether there are custom data points you need to bring in. You can use the Splunk Observability Cloud API to bring in custom data.

You might want to use the API if you want to integrate with:

  • A third-party tool that provides an API/webhook integration only.

  • An application written in a language we don’t provide a library for.

This API integration can send all types of data to Splunk Observability Cloud. While you can use the API to send logs to Log Observer, we recommend using other integration types to do so. For details about which integrations can send logs to Log Observer, see Per product integration recommendations.

After you’ve configured your integration to send custom data, you can access your data in the following locations:

Steps 🔗

For information about using the Splunk Observability Cloud API to send custom data, see Send metrics, traces, and events using Splunk Observability Cloud REST APIs.

Next: Leverage the full benefits of Splunk Observability Cloud 🔗

Now that you have your desired full stack of data coming into Splunk Observability Cloud, consider exploring the following features that can help you monitor, visualize, and coordinate team work around your data:

Support 🔗

If you need assistance setting up or using Splunk Observability Cloud, check the Troubleshooting docs for each feature, or contact Splunk Observability Cloud support.