Key concepts in Splunk APM 🔗
Splunk APM is an Application Performance Monitoring solution that collects every span from every instrumented application to give you a complete picture of the interactions among the microservices that make up your distributed system.
Concept |
Description |
|---|---|
A set of correlated traces that track a transaction or user flow of particular interest. |
|
The number of distinct values in a data set. |
|
A special type of operation where the root span’s |
|
A distinct deployment of your application that doesn’t interact directly with other deployments of the same application. |
|
A span tag for which Splunk generates Troubleshooting MetricSets. |
|
A remote service that is not instrumented in Splunk APM, but which Splunk APM can identify based on information in spans that make calls to the remote service. |
|
A set of metric time series capturing the values of key indicators over time, such as request rate, error rate and durations, calculated based on your traces and spans in Splunk APM. |
|
Metric time series that power the real-time monitoring capabilities in Splunk APM, including charts, dashboards, and detectors. |
|
A specific action performed by a service. |
|
A unit of software that connects to other services to make up a complete application. |
|
A visualization of your instrumented and inferred services and their relationships. |
|
A single operation within a system of applications and services. |
|
A piece of metadata attached to a span that provides more information about the operation the span represents. |
|
A top-down view of your services based on indexed span tags. |
|
A collection of operations, known as spans, that represents a unique transaction an application handles. |
|
Search through all traces from all instrumented services to find the exact trace you’re looking for. |
|
View the span waterfall chart for a specific trace, and search for spans within that trace. |
|
Metric time series used for high-cardinality troubleshooting of identities in APM and for historical comparison among spans and workflows. |
Services are the key components of the systems you can monitor with Splunk APM. The following are service-related terms and concepts.
A special type of operation where the root span’s span.kind = SERVER. A given service typically has one or more endpoints associated with it.
The term “environment” refers to the deployment environment, which is a distinct deployment in Splunk APM that doesn’t interact directly with other deployments of the same application. Separate deployment environments are often used for different stages of the development process, such as development, staging, and production. For more information, see Set up deployment environments in Splunk APM.
A remote service that is not instrumented in Splunk APM, but which Splunk APM can identify based on information in spans that make calls to the remote service. Inferred services often include external service providers, pub/subs, Remote Procedure Calls (RPCs), and databases. To learn more, see Analyze the performance of inferred services.
Use the OpenTelemetry Collector to instrument a service so that it sends its spans to Splunk APM. The SignalFx Smart Agent is now deprecated and will reach end of support on June 30th, 2023. To migrate from the Smart Agent to the Collector, see the migration guide .
See Instrument back-end applications to send spans to Splunk APM to learn more about instrumenting services.
A specific action performed by a service. Each operation in an instrumented service is captured in an individual spans.
A service is a small, flexible, and autonomous unit of software that connects to other services to make up a complete application. A service typically represents a collection of API endpoints and operations that work together with other services’ endpoints in a distributed and dynamic architecture to deliver the full functionality of an application.
“Service” is an umbrella term that encompasses container services (e.g. Docker, Kubernetes), microservices, and even calls to serverless functions. By instrumenting each of the services that make up your application, you can collect spans that represent operations within services and traces that represent collections of operations across services, to analyze and monitor this activity in Splunk APM.
A visualization of your instrumented and inferred services and their relationships. The service map is dynamically generated based on your selections in the time range, environment, workflow, service, and tag filters. See View dependencies among your services in the service map to learn more about using the service map in APM, or see Scenario: Kai investigates the root cause of an error with the Splunk APM service map for a dedicated scenario.
Spans and traces form the backbone of application monitoring in Splunk APM. The following image illustrates the relationship between traces and spans:
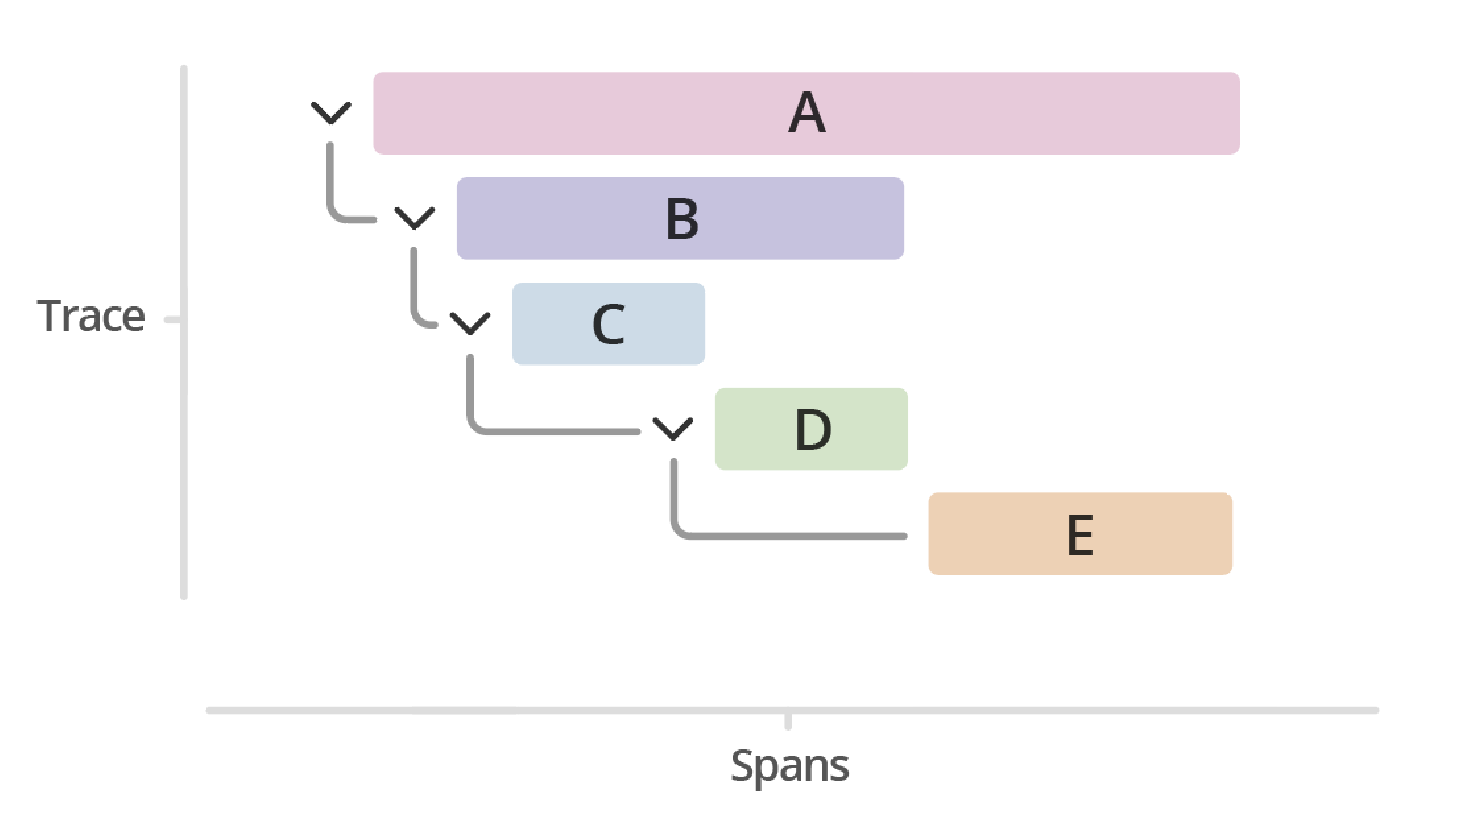
The following are terms and concepts related to spans and traces.
Using Business Workflows, you can correlate a set of related traces that track a transaction or user flow of particular interest.
To learn more, see:
Correlate traces to track Business Workflows for an overview of Business workflows
Scenario: Wei configures Business Workflows to track business KPIs for a scenario involving Business Workflows
When you index a span tag, you indicate to Splunk APM that you are particularly interested in this tag and would like to generate additional analytics for it. Indexing a span tag generates Troubleshooting MetricSets for that tag. When you index a service-level span tag, you also have the option to generate custom dimensionalized Monitoring MetricSets using that span tag as a dimension.
To learn how to index a span tag, see Index span tags to create Troubleshooting MetricSets.
A single operation within a system of applications and services. Spans include span tags, which provide metadata such as the location and duration of the operations they represent. A group of related spans makes up a trace. For more information, see Manage services, spans, and traces in Splunk APM.
A piece of metadata attached to a span that provides more information about the operation the span represents. Examples of span tags include service.name and http.operation. You can add span tags to spans during instrumentation or in the Splunk Distribution of OpenTelemetry Collector. Span tags are also known as “attributes” in the OpenTelemetry context.
For more information, see Analyze services with span tags and MetricSets in Splunk APM.
The Tag Spotlight view in Splunk APM offers a top-down view of your services based on indexed span tags.
To learn more, see:
Get a top-down view of your services in Tag Spotlight for an orientation to Tag Spotlight
Scenario: Deepu finds the root cause of an error using Tag Spotlight for a specific scenario leveraging Tag Spotlight.
A collection of related operations, known as spans, that represents a unique transaction an application handles. For more information, see Manage services, spans, and traces in Splunk APM.
In Trace Analyzer, use Splunk APM’s full-fidelity tracing by searching through all of your traces to find the precise source of a particular issue.
To learn more, see Scenario: Alex troubleshoots an issue to find the root cause using Trace Analyzer for a dedicated scenario leveraging trace search.
In Trace view, you can view the span waterfall chart for a specific trace, and search for spans within that trace.
To learn more, see:
Examine the latency of a specific trace in Trace Analyzer for an overview of Trace View
View and filter for spans within a trace to learn more about span search
MetricSets are the central type of metric data that power Splunk APM.
A MetricSet is a set of metric time series capturing the values of key indicators over time, such as request rate, error rate and durations, calculated based on your traces and spans in Splunk APM. Generate MetricSets by indexing span tags of interest. The following are terms and concepts related to MetricSets.
The number of distinct values in a data set. Low cardinality data has a small number of distinct values. High cardinality data has a large number of distinct values, and requires more computation and storage to analyze and store.
See Troubleshoot cardinality in Monitoring MetricSets to learn more about working with high cardinality data.
Metric time series used to monitor and alert on the performance of your services in real time. MMS power the real-time APM Landing Page and the dashboard view, and are the metrics that detectors monitor and use to generate alerts. MMS use the same functionality as metric time series in Infrastructure Monitoring to monitor and alert on the performance of applications and services.
For more information about MMS, see Monitoring MetricSets.
Metric time series used for high-cardinality troubleshooting of identities in APM and for historical comparison among spans and workflows. Splunk APM generates TMS based on indexed span tags.
To learn more, see Troubleshooting MetricSets .