Learn what you can do with Splunk APM 🔗
Once you have data flowing into Splunk APM, it’s time to do some exploring. Explore what APM can help you accomplish by following these steps:
Prerequisite 🔗
Before you begin to explore APM, make sure you are sending traces to APM from your services. See Send traces to Splunk APM to learn more.
Assess the health of your applications with the APM landing page 🔗
When you log into Splunk Observability Cloud and select APM from the navigation menu, you arrive on the APM landing page. You can use this dashboard of consolidated and unsampled span metrics to get a real-time snapshot of your services and Business Workflows at a glance.
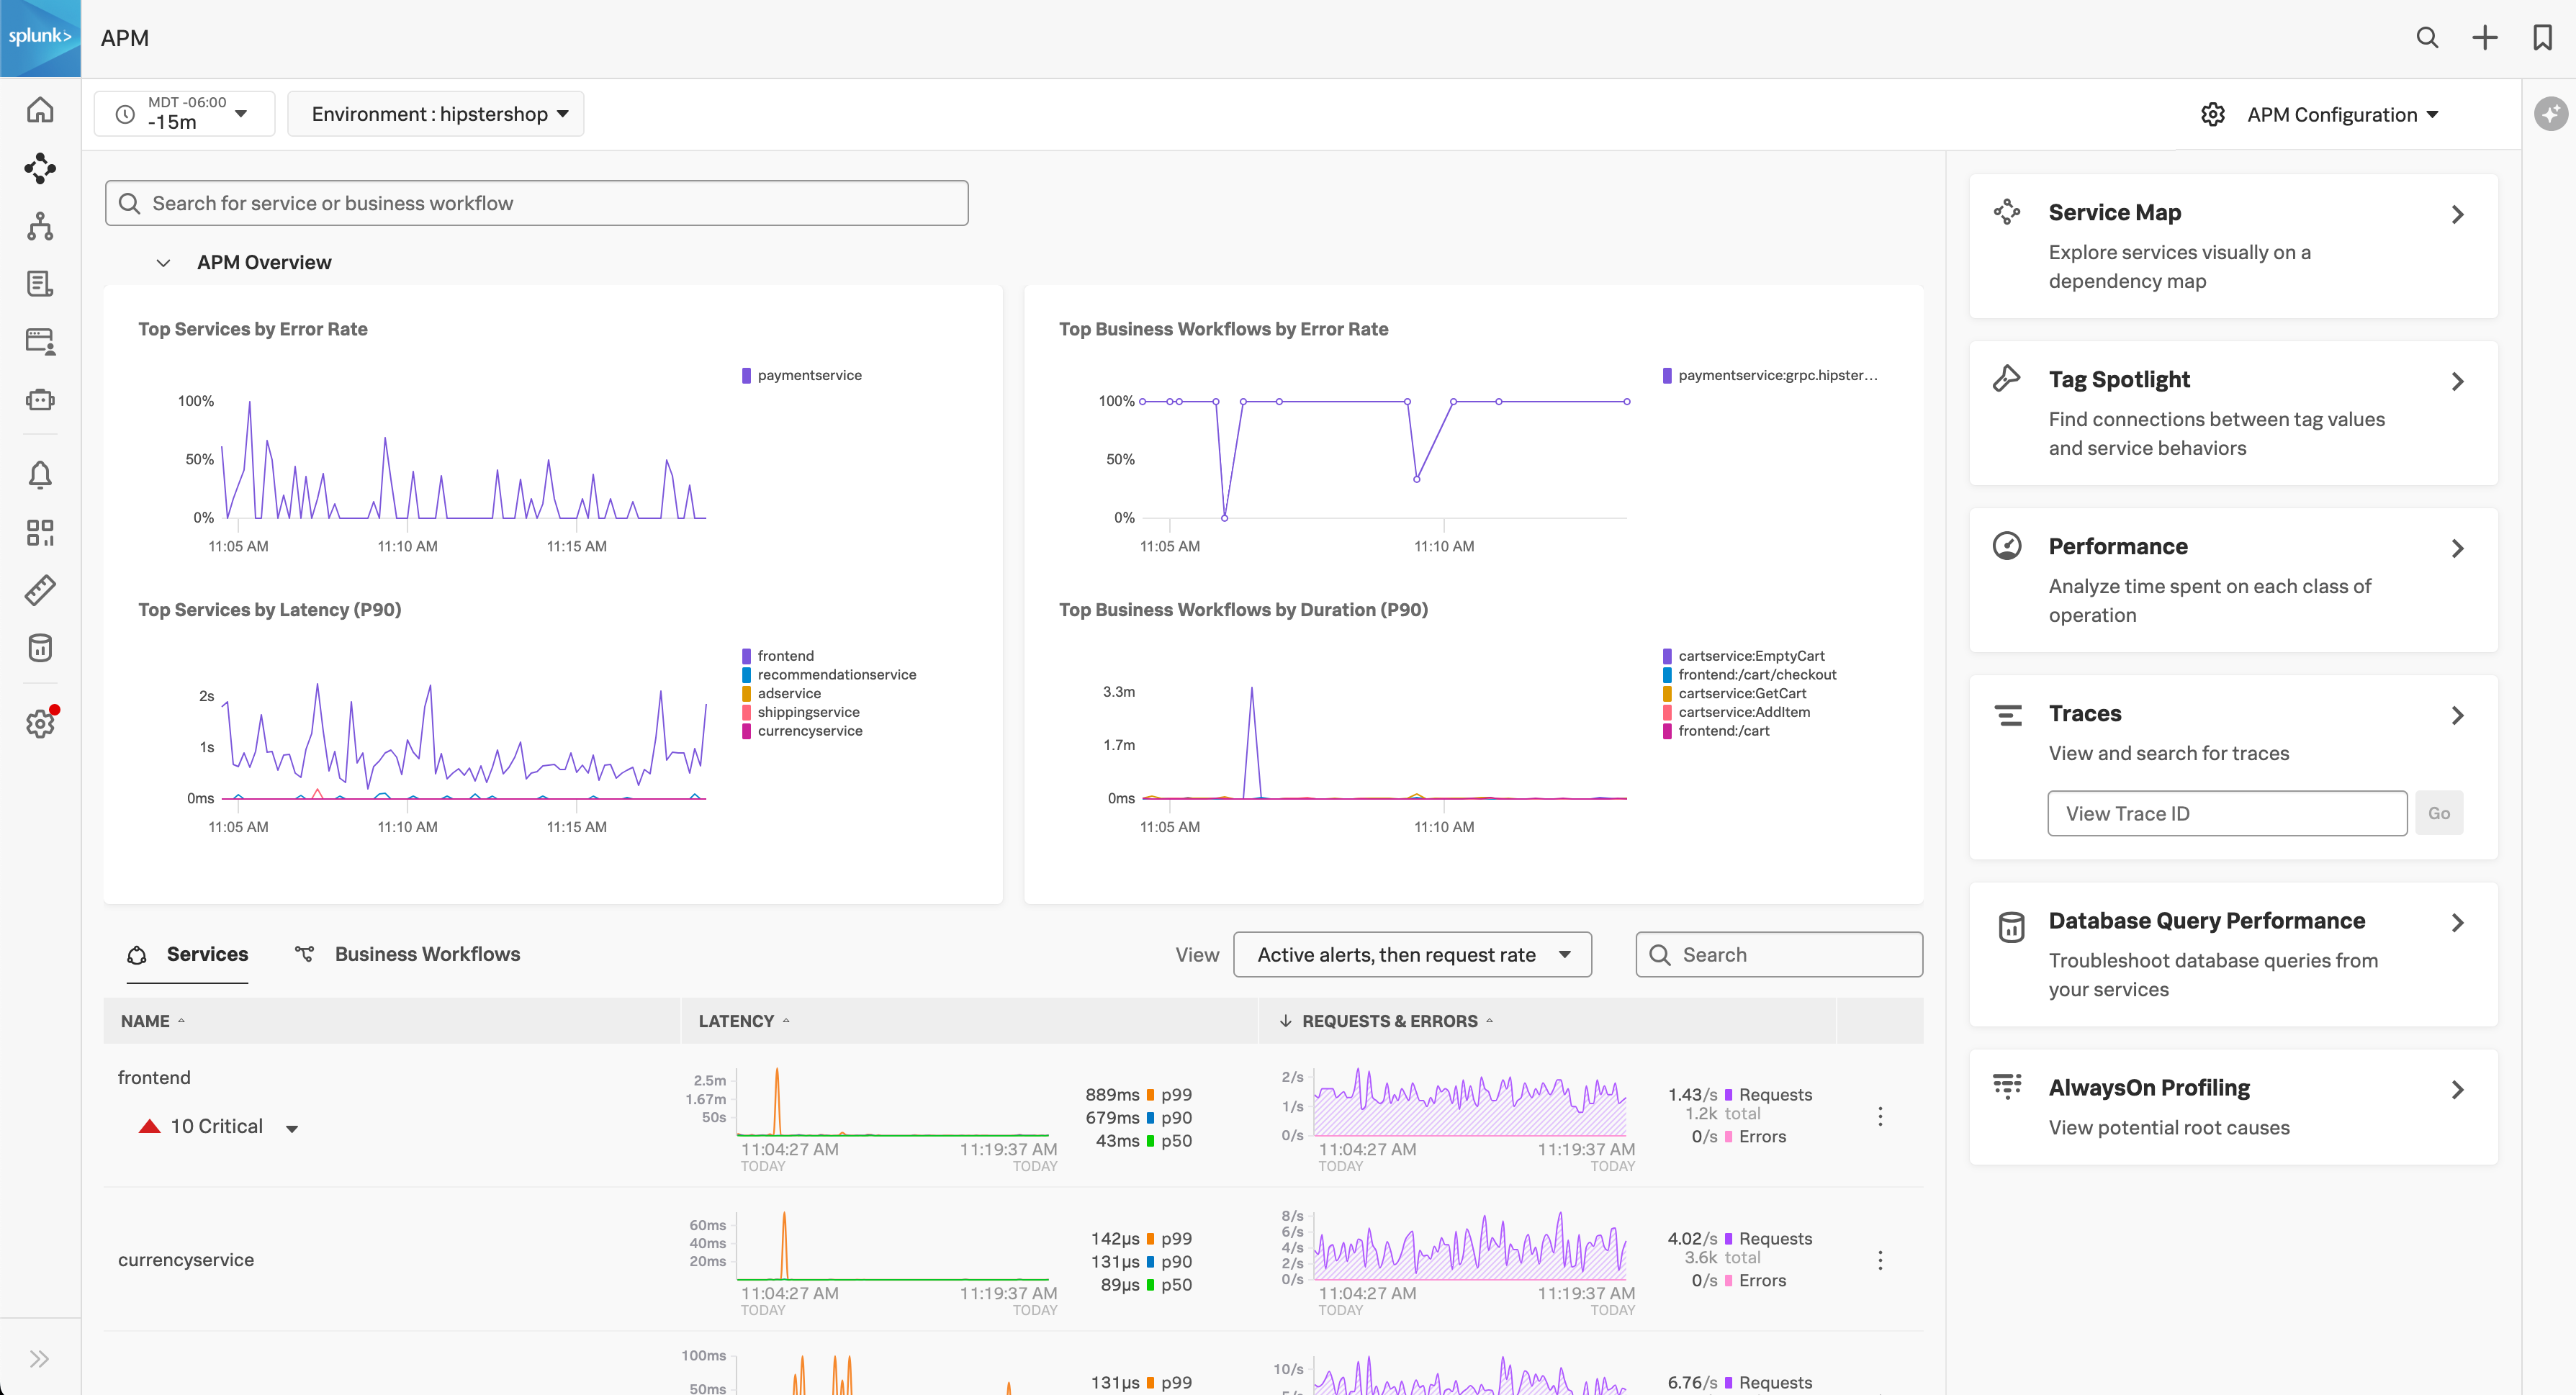
Use the alerts and top charts on this page as a guide to what needs your attention first.
View dependencies among your applications in the Service Map 🔗
From the landing page, select the Service Map card. The Service Map presents the dependencies and connections among your instrumented and inferred services. Use time range, environment, workflow, service, and tag filters to refine the Service Map.
You can use these visual cues to understand dependencies, performance bottlenecks, and error propagation.
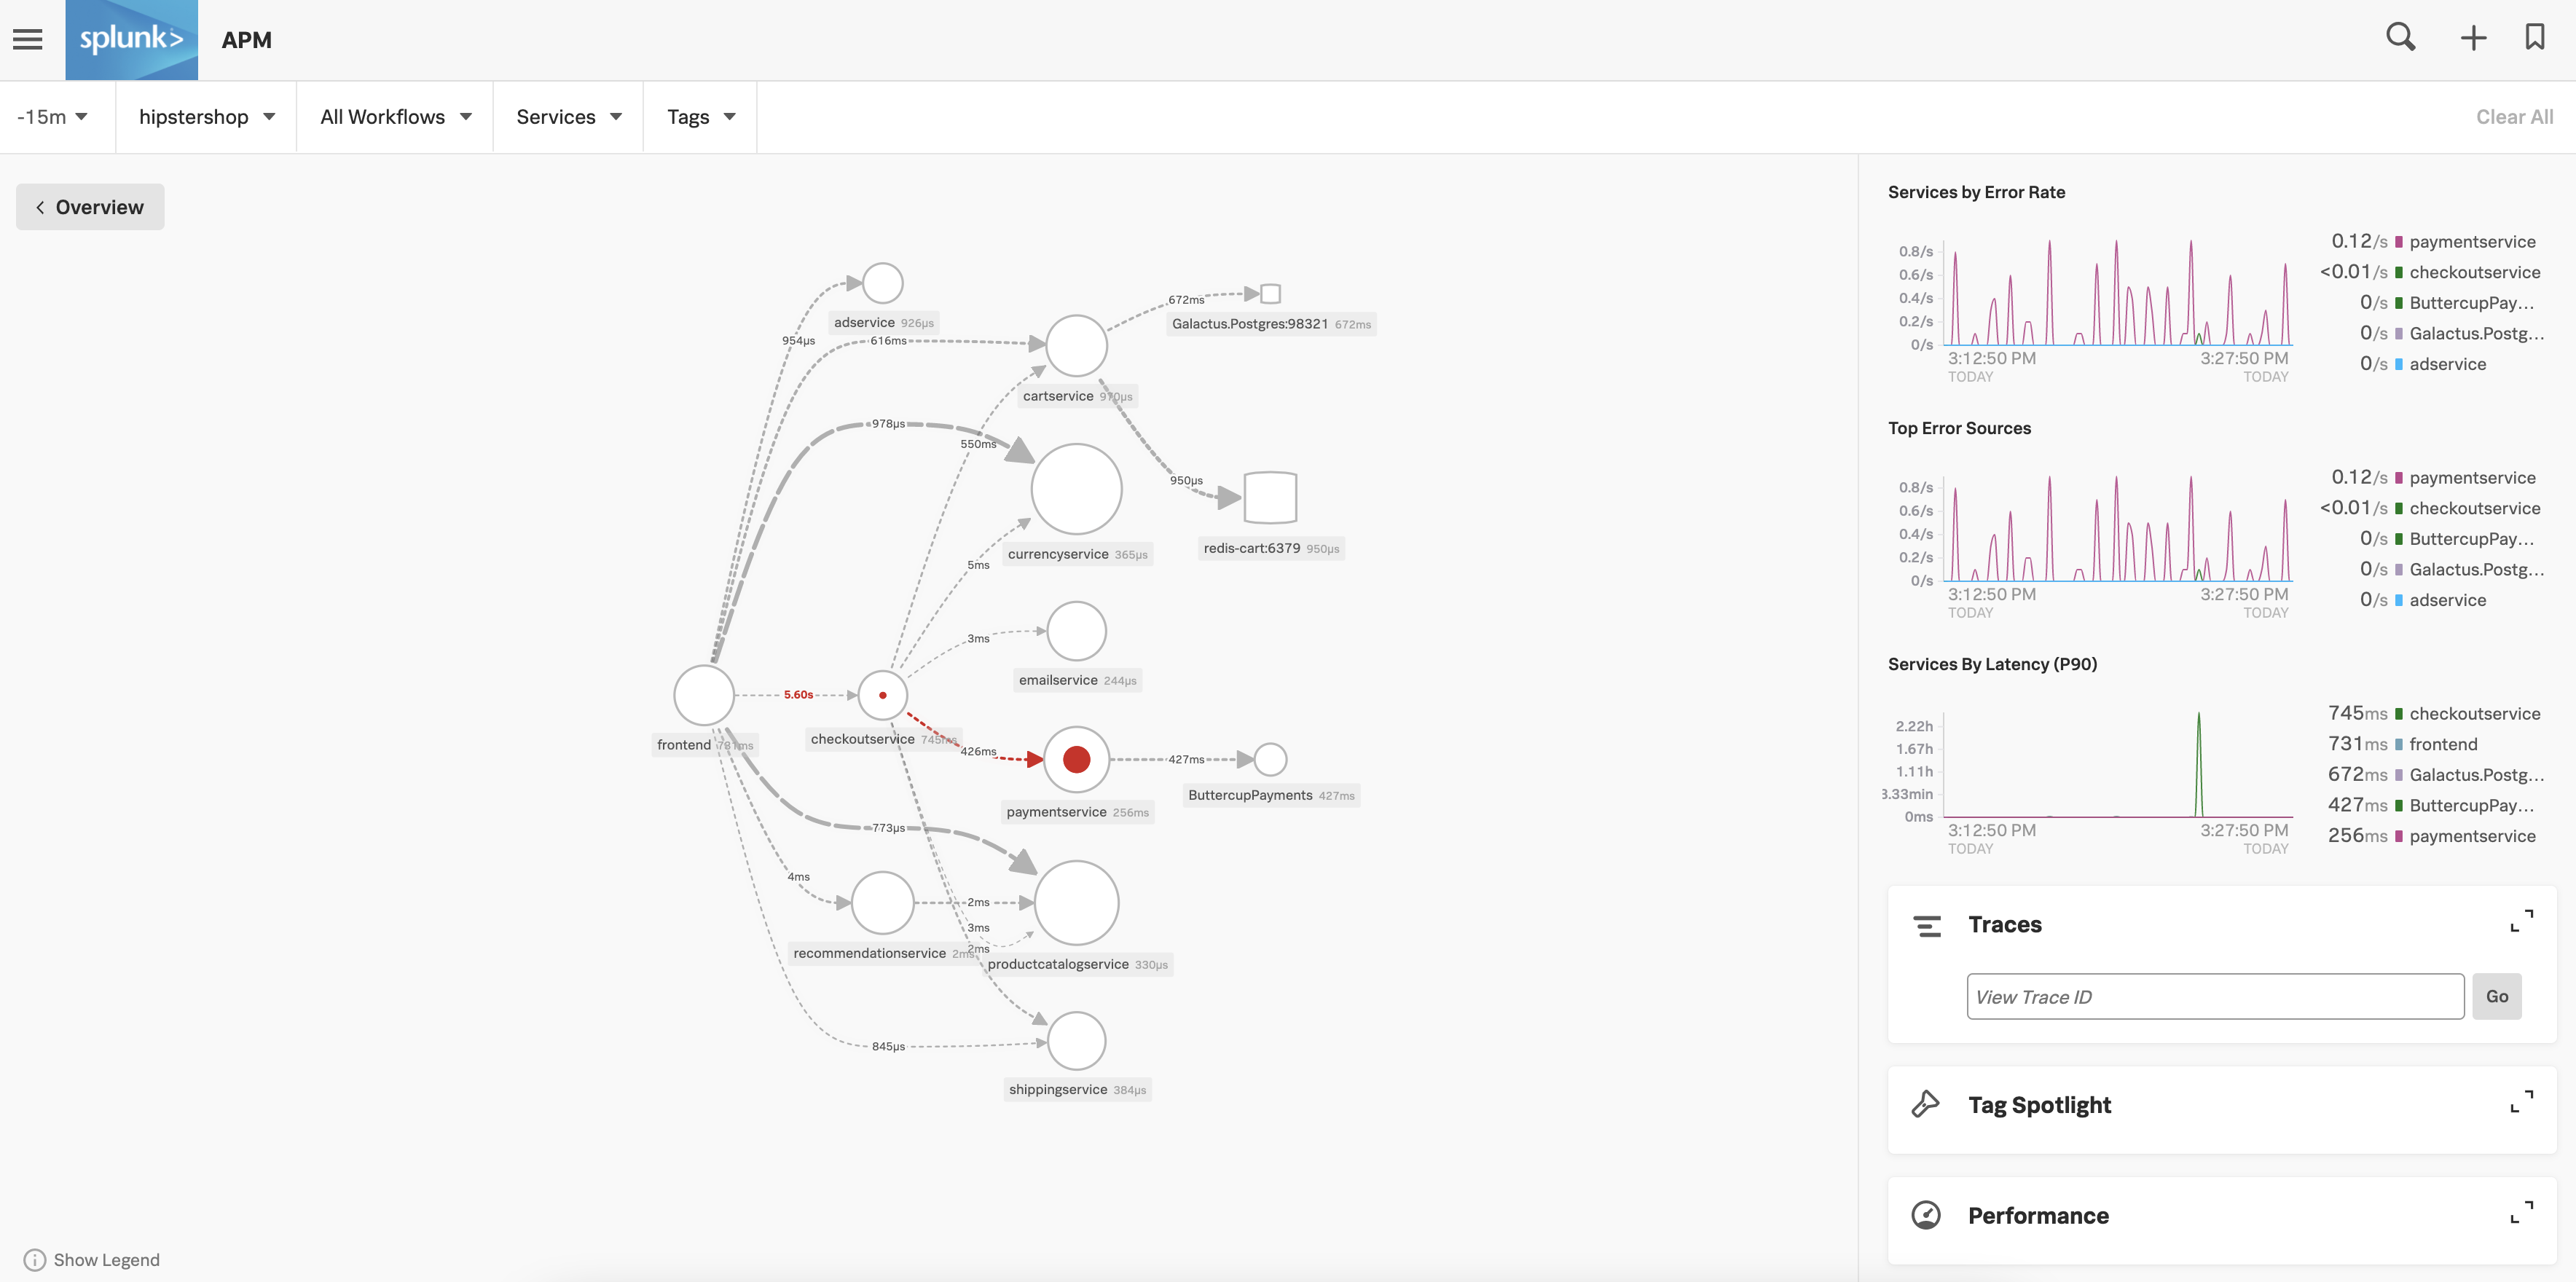
Select any service in the service map to see charts for that specific service. You can also use the Breakdown selector to break the service down by any indexed span tag.
Select any chart in this view to show example traces that match the parameters of the chart.
To learn more about the service map, see View dependencies among your services in the service map.
Examine the latency of a specific trace in Trace Analyzer 🔗
Select Traces to navigate to Trace Analyzer, where you can see a list of traces from the services you’ve instrumented in Splunk APM. From the list of traces, you can select a specific trace, search by trace ID or use advanced trace search to view the waterfall chart for a particular trace.
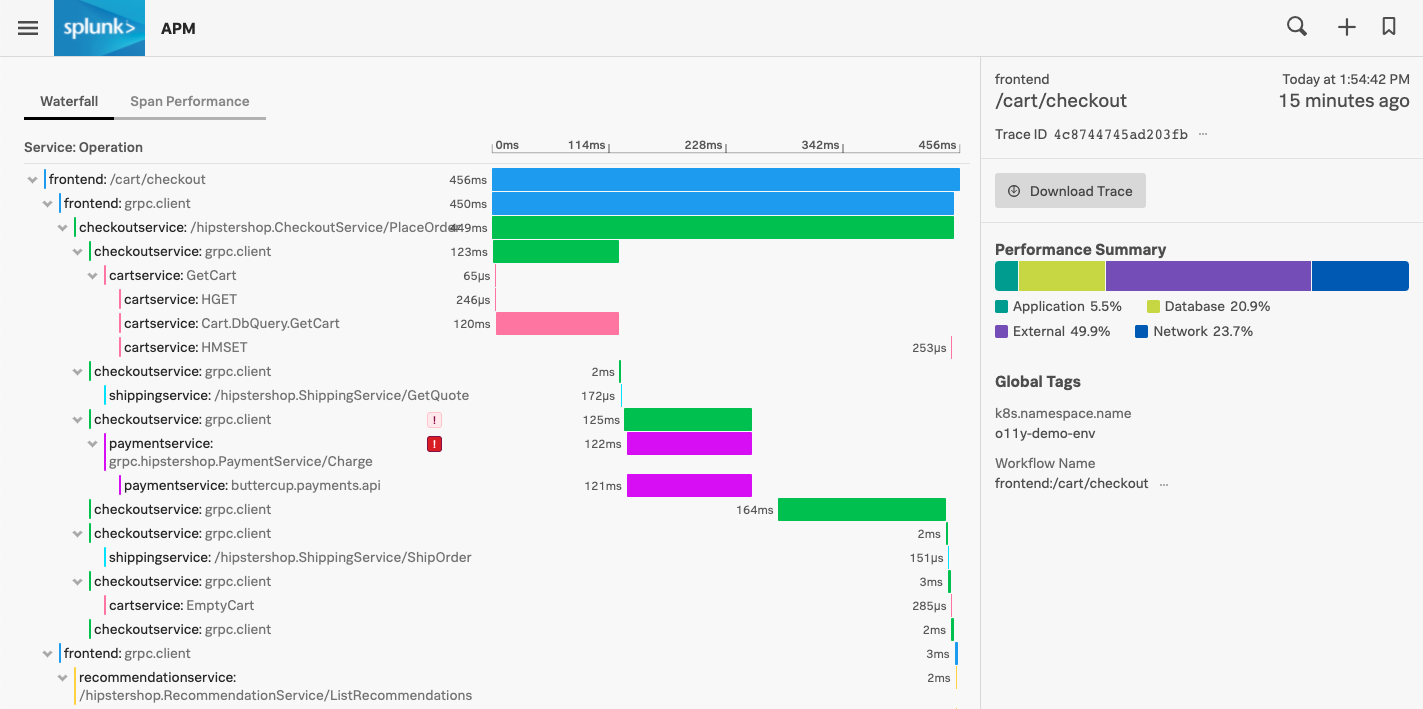
The waterfall chart provides a visualization of the latency of all of the spans that make up the trace being viewed. Under Performance Summary, you can get a snapshot of the performance of the types of spans comprising the trace.
Under the Span Performance tab, you can view a summary of span duration from each operation within each service involved in the trace and the percentage of overall trace workload that they represent.
Full-fidelity tracing, in which APM receives all traces from each of your services rather than sampling them, helps you find and solve specific problems arising in individual traces. With full-fidelity tracing, you never need to wonder whether a trace representative of a particular issue was captured by a sample.
In addition to searching individual traces, you can get an aggregate view of your traces to see where problems are occurring across your systems using tools such as Tag Spotlight.
Get a top-down view of your services in Tag Spotlight 🔗
Return to the service map and select Tag Spotlight. Using Tag Spotlight, you can view the request and error rate or latency by span tag for an individual service or business workflow. This helps you identify which particular attributes of your system might be causing reliability or performance issues.
Rather than looking for similarities across multiple traces, you can use Tag Spotlight to gain a top-down view of your services. This lets you identify the system-wide source of issues and then drill down to find an individual trace that is representative of a wider issue.
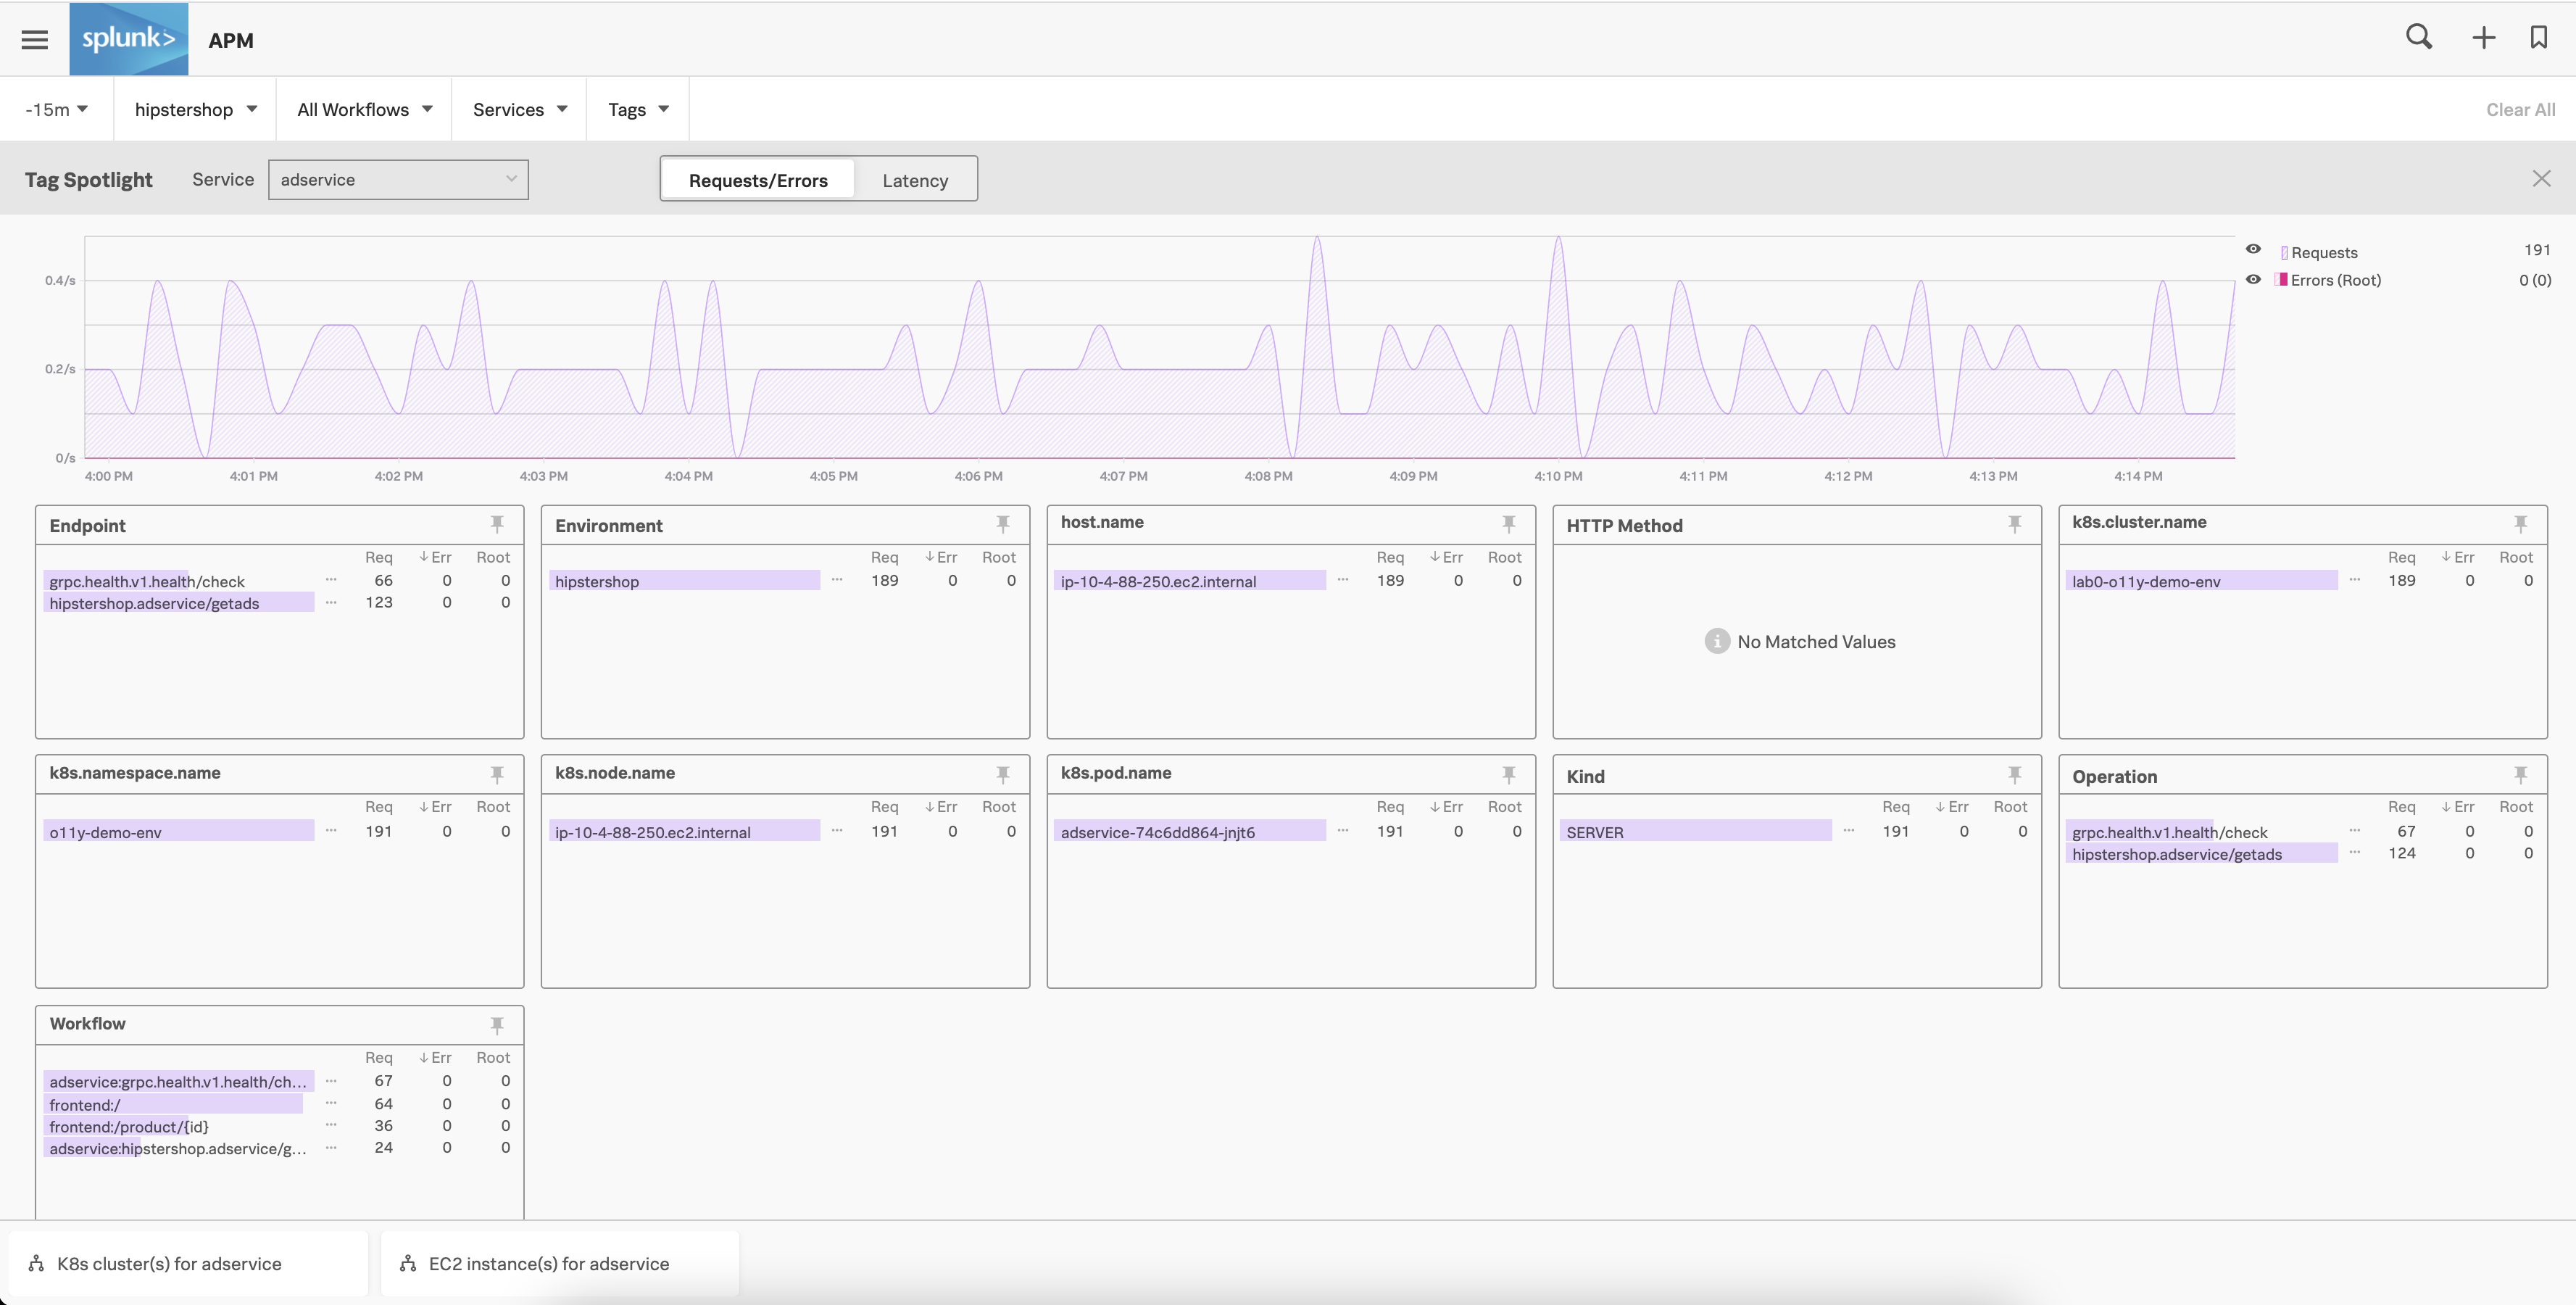
Splunk APM indexes a set of span tags by default, which are shown as boxes in Tag Spotlight. See Default indexed span tags in APM for the list of these default tags. By indexing additional span tags, you can have other tags appear in their own boxes on this page. To learn how to index additional span tags, see Index span tags to create Troubleshooting MetricSets.
When you navigate to Tag Spotlight from the service map and have a specific service selected, all of the information in trace view and Tag Spotlight preserves the context of that particular service.
To learn more about Tag Spotlight, see Analyze service performance with Tag Spotlight.
Next step 🔗
Now that you’ve explored what you can do with Splunk APM, start tailoring Splunk APM to fit your business needs. See Customize your Splunk APM experience to learn more.