View and filter for spans within a trace 🔗
In the trace waterfall, you can filter visible spans based on tag values or error status, as the following animation demonstrates:
Follow these steps to filter for a span within a trace:
On the Splunk APM landing page, select Traces.
There are 2 ways to find a trace:
Enter a specific
traceIdin the search bar.Use the filters in Traces view to find a trace of interest.
When you have found the trace you are interseted in, select the Trace ID of the trace to open the trace Waterfall.
Select Add filters to select span tag values to filter the trace waterfall to specific spans. Spans matching your filter are highlighted in blue.
Use span filter logic 🔗
When you select multiple tag values within a single tag name, the filter applies Boolean OR among the tag values. When you select multiple tag names, the filter applies Boolean AND to each tag name. Use the Matches only switch to show only spans that match your filter. After you find a span you are interested in, select that span to expand it and see its metadata.
Show spans in context 🔗
When filtering for a span, select the Matches Only switch to show only spans matching your filter criteria. Then, once you’ve found a span or spans you’re interested in, turn the Matches Only switch back off to show the spans in context. Use the Matches Only filter to narrow down the spans of a large trace to find the exact span you’re interested in, while still retaining visibility of that span’s before-and-after context and dependencies.
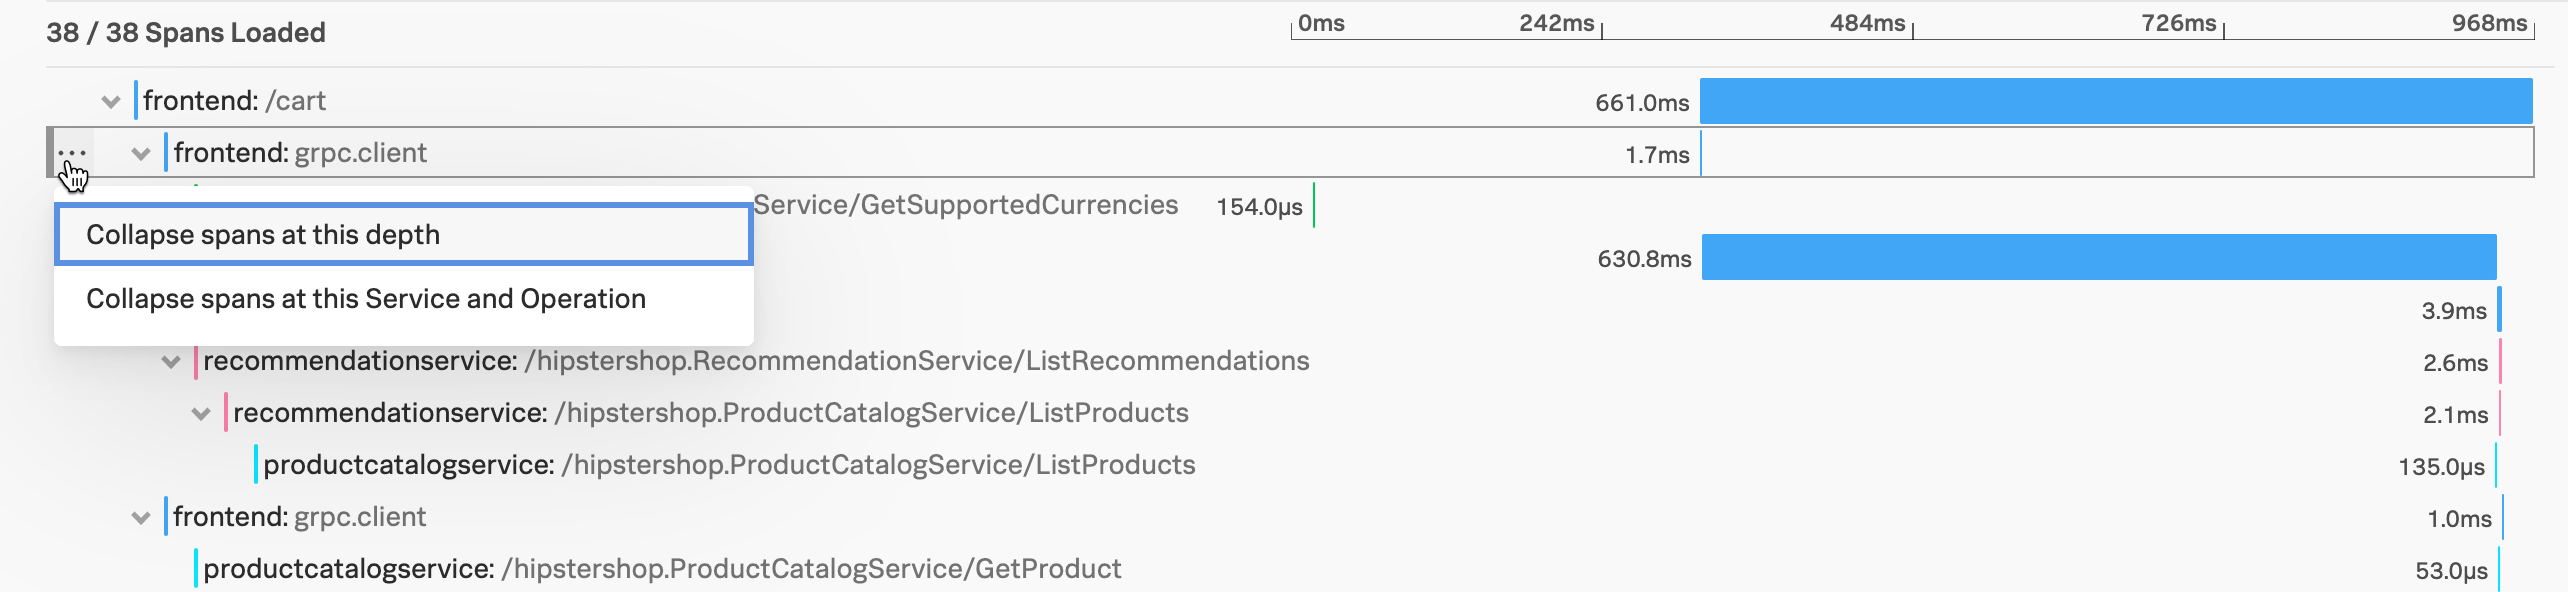
Expand and collapse spans 🔗
Use the 3-dot menu next to each span to expand and collapse spans as needed. You can expand or collapse at a specific depth or at the service and operation level.
Identify repeated spans 🔗
When a trace contains multiple repeated spans, the spans are collapsed into 1 row and a multiplier is displayed next to the row to reflect the number of repeated spans. Select the multiplier (x3, x7, and so on) to expand the row to view the individual spans and durations. The span summary displays the total span count and the repeated tags associated with the repeated spans.

Identify the services that contribute spans to a trace 🔗
The colors of spans in the waterfall help differentiate the services contributing spans to a trace. If every span in the trace is from the same service, all spans appear in the same color. If there are 4 different services involved, the spans are in 4 different colors, to differentiate the service they’re from.
View connected spans and traces using span links 🔗
Span links connect spans that don’t have a direct parent-child relationship but are otherwise causally related. Span links help you to manage operations in distributed systems, where operations don’t follow linear execution patterns. Use span links to preserve span context when producer spans create jobs that are asynchronously processed later. These might be remote jobs that are added to a job queue or local jobs handled by an event listener. In this case, span links connect the producer spans to the consumer spans that represent the processing of the jobs created by the producer. These consumer spans might start long after the producer span has ended.
See https://opentelemetry.io/docs/concepts/signals/traces/#span-links to learn about the OpenTelemetry concept.
See https://opentelemetry.io/docs/languages/java/instrumentation/#create-spans-with-links for instrumentation details, including instructions for how to create span links.
You can view span links on spans in the trace waterfall view. Select the link to see the correlated spans and traces then select the span or the trace to navigate to the span.

View RUM session details 🔗
For spans that also have RUM session details, the word RUM displays in the span. Select the RUM link to view the session in RUM. To view the RUM session details, select the span and then select the RUM Session tab in the Trace Properties panel. You can also select the session ID to go to RUM.

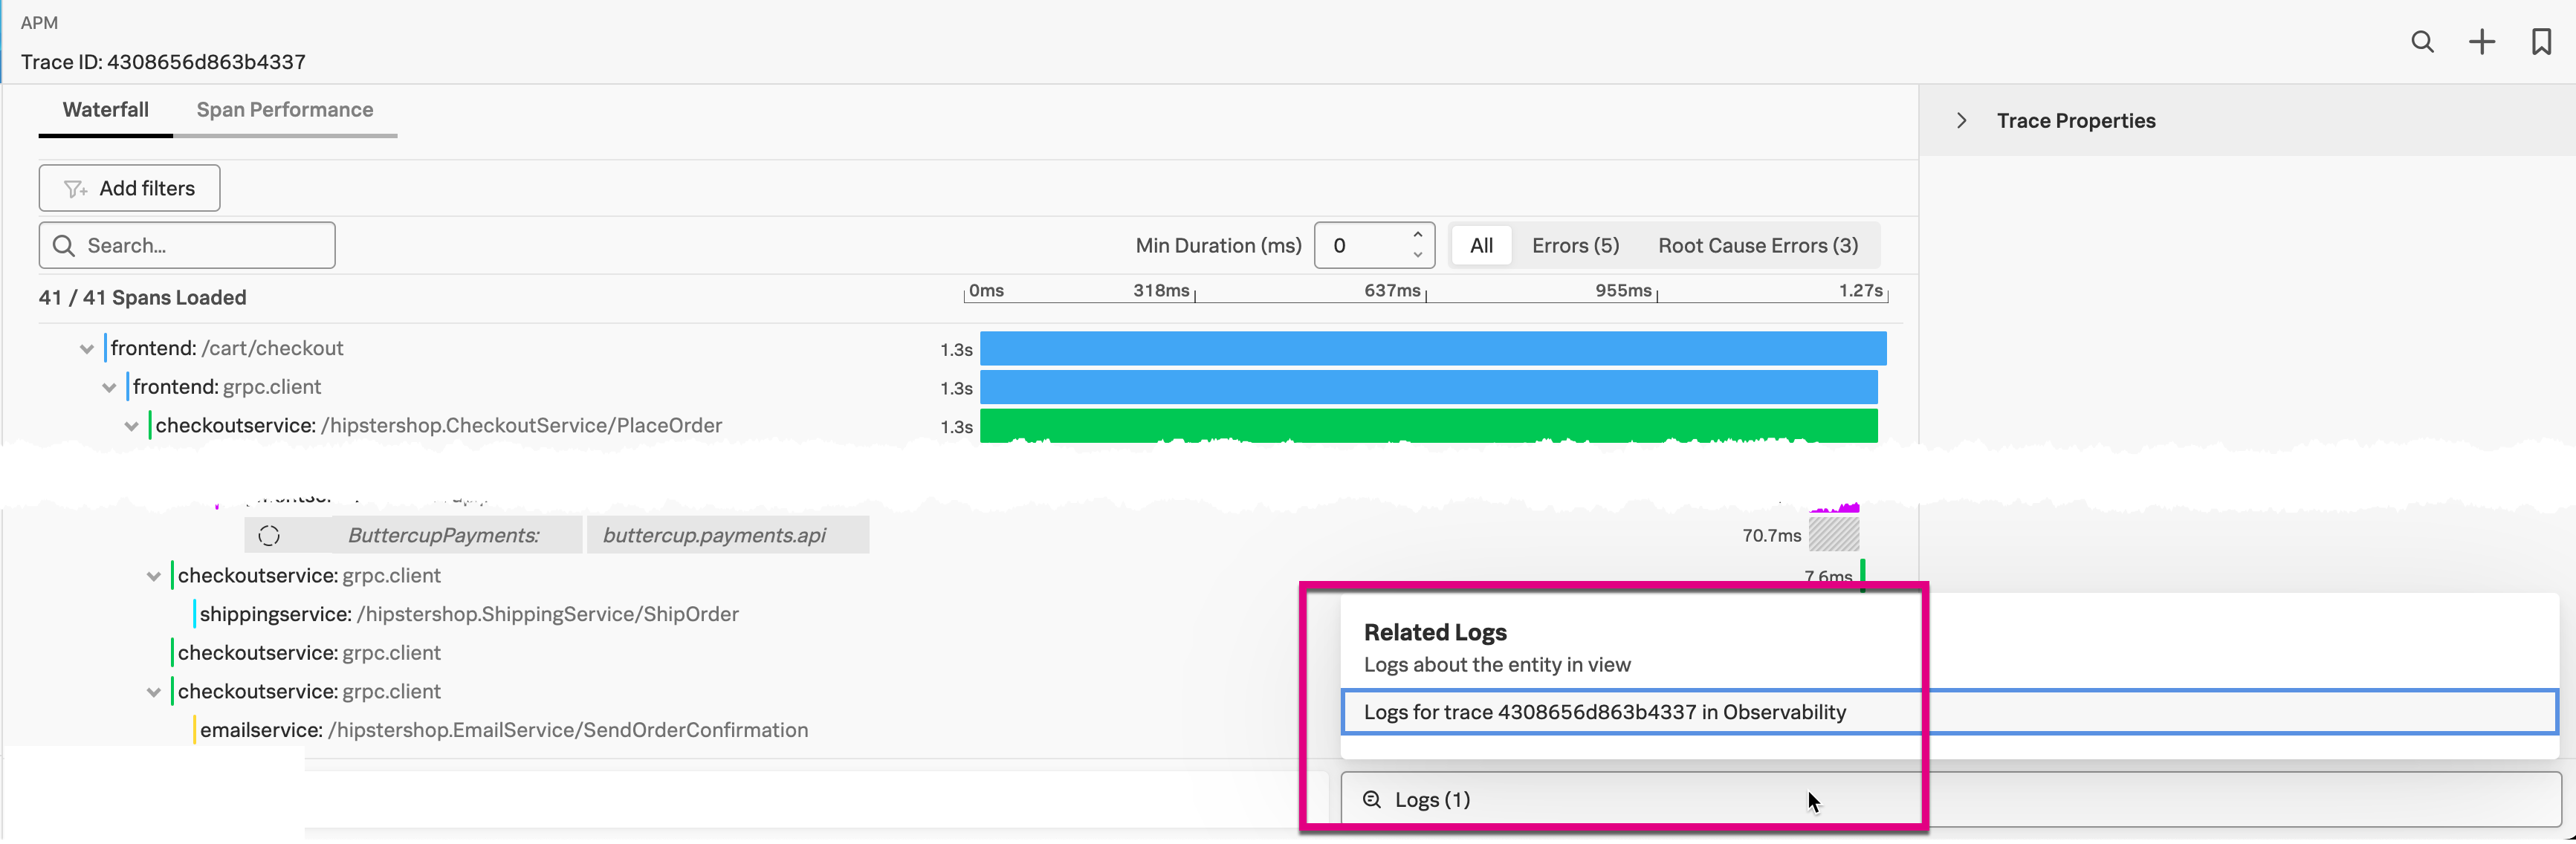
Explore logs for each span 🔗
If you turned on Related Content, you can jump to related logs, when available, for each trace and its spans. The following image shows the related logs in Log Observer for a specific trace.
See Configure the Collector to enable Related Content for Infra and APM for more information.
Continue troubleshooting in Tag Spotlight 🔗
Expand a span of interest in the waterfall chart and select the spotlight icon that appears beside an indexed tag to navigate to Tag Spotlight. Tag Spotlight can help you isolate specific indexed span tags associated with trends in request rate, error rate, or latency and get to the bottom of what’s causing problems. See Analyze service performance with Tag Spotlight to learn more about using Tag Spotlight.