Special cases for spans and traces in Splunk APM 🔗
Learn about the following special cases for spans and traces that you might encounter in Splunk APM:
Ongoing traces 🔗
Splunk APM assembles incoming spans into traces and analyzes them to give you full fidelity access to your application data.
What is an ongoing trace? 🔗
An ongoing trace is an incomplete trace. The spans within an ongoing trace are still being ingested and assembled. With an ongoing trace, you don’t have to wait for the entire trace to complete to view incoming spans as they are being assembled.
Why might a trace be ongoing? 🔗
The processing pipeline processes spans, associates them with traces, and saves associated metrics. The processing pipeline takes time. Spans that are still in the processing pipeline are considered “live spans”. When processing is complete and the spans are in final storage, the spans are no longer considered live.
When you request a specific trace by trace ID, we check the processing pipeline for live spans with that trace ID. If we find any live spans, then we consider the trace to be ongoing. If we don’t find any live spans, and we do find spans in final storage, we then check to see if the trace is ongoing. To do so, we look for the following conditions:
Missing spans
Trace age, by examining the most recent timestamp for spans in the trace.
If a trace is missing spans and the trace has a span with a recent timestamp, then the trace is considered ongoing. If a trace has missing spans and the most recent timestamp is old, then we consider the trace to be broken.
How to find ongoing traces 🔗
Note
If you have a Log Observer license, make sure the trace_id field is present in your logs. This field helps you find ongoing traces in APM.
To view an ongoing trace, do the following:
- Identify the trace ID of an ongoing trace you’re interested in. If you use Log Observer, you can use the following steps to find the
trace_idof an ongoing trace. Otherwise, you can find the ID of an ongoing trace in another logging system that collects trace IDs. Navigate to Log Observer in Splunk Observability Cloud.
In log search, select Add Filter to open the filter dialog box and select Fields.
In the Field search bar, enter the name of a field value associated with trace IDs, such as
trace_id. To learn more about mapping log events fields to key names in APM, see the Splunk Log Observer section in Enable Related Content.To search all logs that contain the field you searched, type
*in the value search bar and select the=button to apply the filter. Log search now shows all logs that contain the field you searched.Select a recent log containing a trace of interest to open it in the sidebar.
Find the trace ID field and copy its value.
(Optional) To view all logs containing that specific
trace_ID, select the value of thetrace_IDfield and select Add to filter from the list. Log search now shows all logs containing thetrace_IDvalue.
- Identify the trace ID of an ongoing trace you’re interested in. If you use Log Observer, you can use the following steps to find the
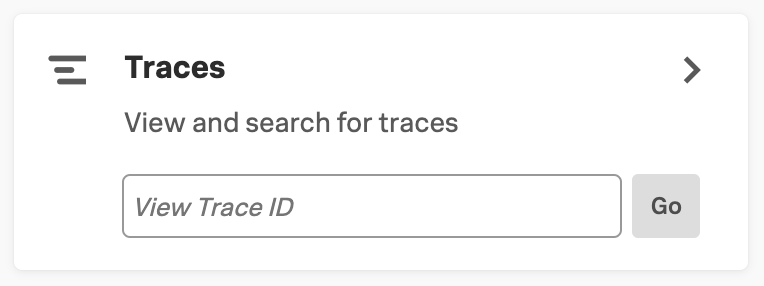
Enter the trace ID you copied in the search bar of the Traces tile of the APM landing page and select Go. If the trace exists, Trace Waterfall view opens.
From the Trace Waterfall view for an ongoing trace, use the Refresh Trace button to load newly ingested spans in real time.
Note
When you’re viewing an ongoing trace, spans are still being ingested. Some spans might be missing their parent spans. See Traces with missing spans to learn more.
Inferred spans 🔗
An inferred span represents an operation in a service that is not instrumented in Splunk APM, but which Splunk APM can infer based on information in spans that call an uninstrumented service. The following screenshot demonstrates that inferred spans are shown in a gray box with italicized print in Trace Waterfall view.
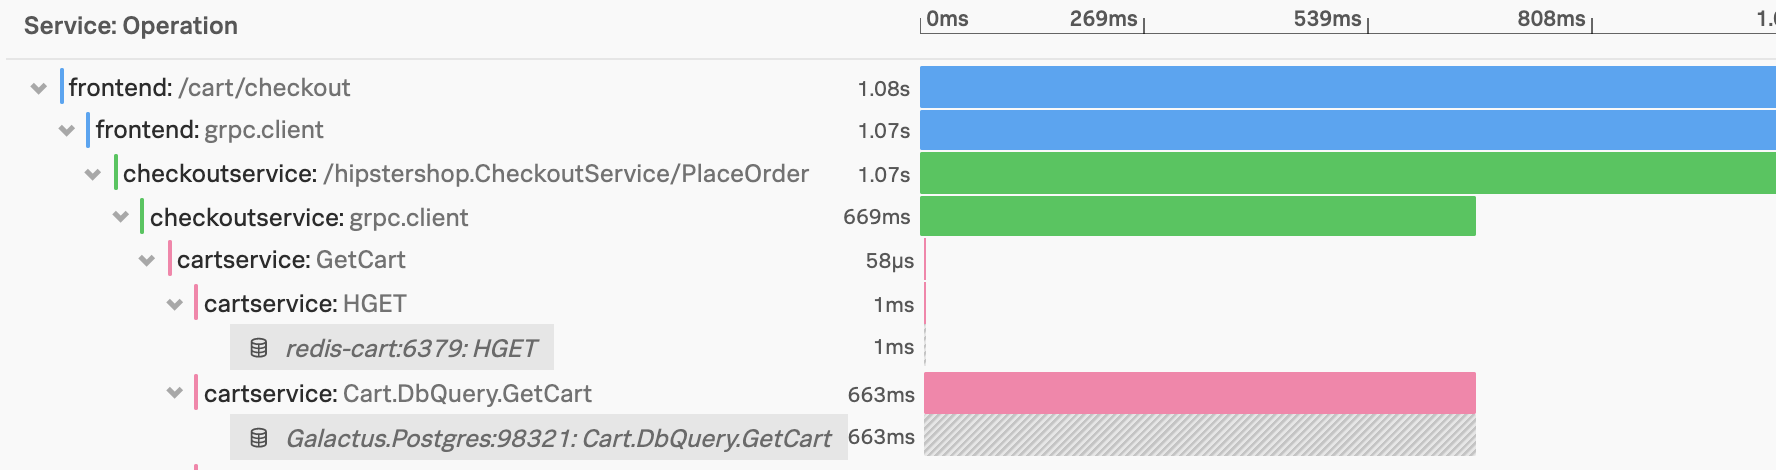
To learn more about inferred services and inferred spans, see Analyze the performance of inferred services.
Trace ingestion 🔗
Traces can take a few minutes to be available for troubleshooting, depending on the time taken to ingest and assemble incoming spans. This allows to provide unique insights such as error sources and breakdowns on the service map.
As troubleshooting starts from real-time alerts, all relevant traces are available by the time you get to the alert and start investigating the issue.
You can search for specific trace IDs gathered from other data sources, such as logs or Jenkins jobs, to see incoming spans for that trace in the trace view without having to wait for the trace to complete.
Traces with missing spans 🔗
Spans with an orange dot in Trace Waterfall view indicate that the parent span is missing. The following image shows the orange dot that appears beside a span missing its parent:

A parent span might be missing for the a number of reasons, including the following:
The trace is still being ingested, so not all spans are collected yet. See Ongoing traces to learn more.
The span was not sent to Splunk APM due to incomplete instrumentation. See Troubleshoot your instrumentation to help resolve potential issues with your instrumented applications.