Scenario: Apply adaptive thresholds to a KPI and detect outliers
The following scenario walks through the process of configuring adaptive thresholding for a KPI. The sample KPI represents logins to a web server that exhibits different behaviors each day of the week and each hour of the day.
In this example, the training window is 7 days. However, as you identify smaller and smaller time policies, you might need to increase it to 14, 30, or 60 days to ensure that you have adequate data points in your short time windows to generate meaningful threshold values.
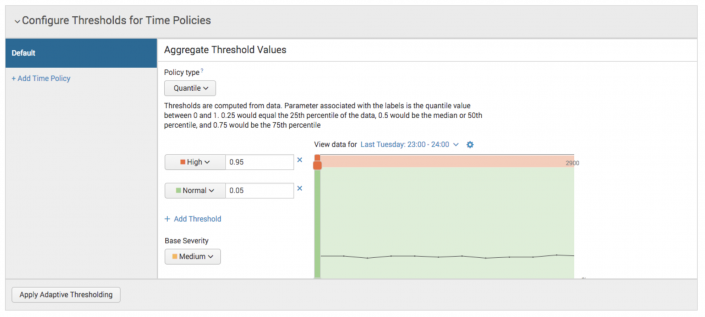
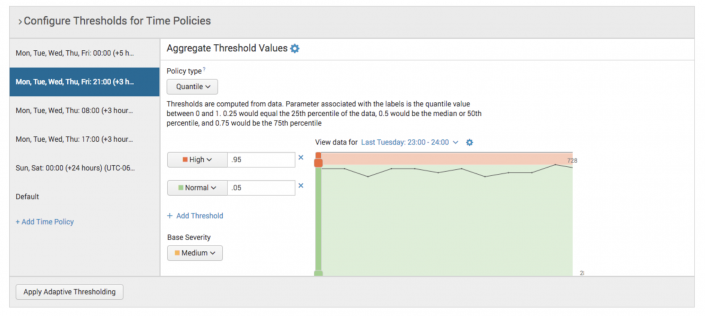
To begin your policy configuration, you must decide on the severity parameters for the chosen adaptive thresholding algorithm that align with your severity definitions. You've determined the following information about your data:
-
Quantileis the right algorithm for this KPI. - >95% is the high threshold.
- <5% is the medium threshold.
You click Apply Adaptive Thresholding.
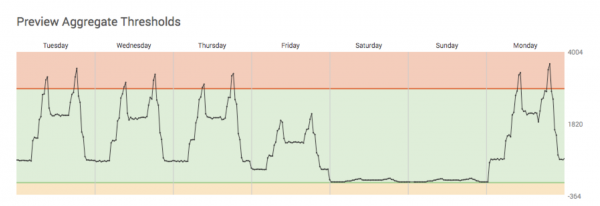
The first thing you're likely to notice when looking at the week-long KPI graph is that certain times of the day or days of the week are predictably different than other times. Perhaps AM differs from PM, or weekends differ from weekdays. These variations are almost always explainable and expected, but you should work with the service owners to confirm.
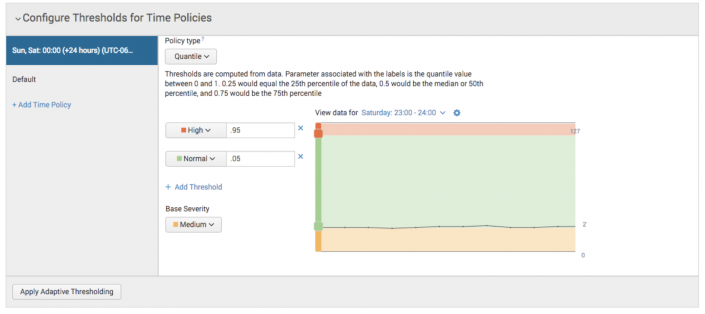
Presuming the variation is expected, the next step is to create a time policy to encapsulate that difference. In your case, you expect weekend traffic to your site to be very light. You start by separating weekend traffic from the work week with a new time policy. Apply the same adaptive threshold algorithm and severity values to your new time policy, and apply adaptive thresholds again.
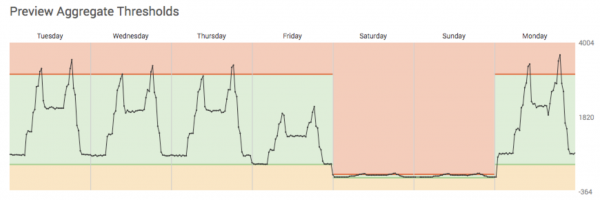
ITSI only uses the historical data points within that time policy to determine the threshold values. Thus the difference is now better accounted for.
It's clear that you've made improvements, but you still see problems. There are some spikes going into the red on Monday. After working with the service team, they tell you that logins predictably spike around 8am and 5pm most every day of the work week. You can create time policies to isolate those spikes. You can also create time policies to isolate the work week evenings where things are quieter.
The thresholds might not be perfect and you'll probably have to continue this process to create the right number of time policies. However, you've applied a methodical approach and can justify the purpose of each time policy.
| Create custom threshold windows in ITSI | Overview of deep dives in ITSI |
This documentation applies to the following versions of Splunk® IT Service Intelligence: 4.17.0, 4.17.1, 4.18.0, 4.18.1, 4.19.0, 4.19.1, 4.19.2, 4.19.3, 4.19.4, 4.20.0, 4.20.1

 Download manual
Feedback submitted, thanks!