Use the Predictive Analytics dashboard in ITSI
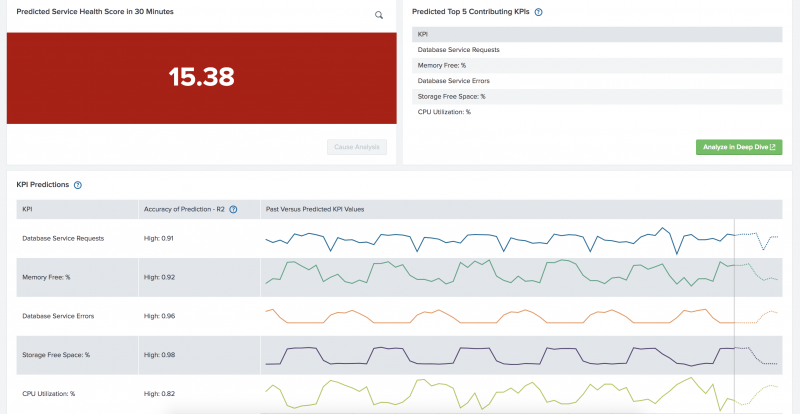
The Predictive Analytics dashboard helps predict the future health score of a selected service in IT Service Intelligence (ITSI). Machine learning algorithms use historical KPI and service health score data to model what a service's health might look like in 30 minutes. Perform root cause analysis by viewing the top five KPIs contributing to a potential outage and how those KPIs are likely to change in the next 30 minutes.
Based on the findings from your root cause analysis, you can take the necessary steps to prevent an imminent service outage before it happens. For example, if you discover that the top offending KPI is Database Service Requests, you can notify the Database team about the predicted outage and request that they address the problem.
Prerequisites
To use the Predictive Analytics dashboard, you first need to train and test a predictive model for the selected service. See Overview of Predictive Analytics in ITSI in the Service Insights manual.
Steps
To predict a service's health score, select a service, then a model. The "Recommended" model is the one that performed the best overall according to industry-standard metrics like R2 and RMSE. After you select a model, the dashboard populates with the predicted health score for that service. Click Cause Analysis to view and analyze the top five KPIs that could be contributing to that service's predicted health score.

For information about the algorithms used to generate the models, see Choose a machine learning algorithm in the Service Insights manual.
Dashboard panels
Use the following panels to aid in root cause analysis:
| Panel | Description |
|---|---|
| Predicted Service Health Score in 30 Minutes | The predicted health score of the selected service in 30 minutes according to the machine learning model you choose. The model uses multivariate forecasting to predict the service's health score. |
| Predicted Top 5 Contributing KPIs | The top five overall KPIs that might be contributing to the predicted service health score. These KPIs can belong to the selected service or to a service that this service depends on. |
| KPI Predictions | How the top five contributing KPIs have changed over the last six hours, and how they are predicted to change according to the model over the next 30 minutes. The predictions are made at five-minute intervals, for a total of six discrete predicted health score values. |
| Delete a predictive model in ITSI | Predictive Analytics performance considerations in ITSI |
This documentation applies to the following versions of Splunk® IT Service Intelligence: 4.11.0, 4.11.1, 4.11.2, 4.11.3, 4.11.4, 4.11.5, 4.11.6, 4.12.0 Cloud only, 4.12.1 Cloud only, 4.12.2 Cloud only, 4.13.0, 4.13.1, 4.13.2, 4.13.3, 4.14.0 Cloud only, 4.14.1 Cloud only, 4.14.2 Cloud only, 4.15.0, 4.15.1, 4.15.2, 4.15.3, 4.16.0 Cloud only, 4.17.0, 4.17.1, 4.18.0, 4.18.1, 4.19.0, 4.19.1, 4.19.2, 4.19.3, 4.19.4, 4.20.0, 4.20.1
 Download manual
Feedback submitted, thanks!