Aggregate versus maximum severity KPI values in ITSI
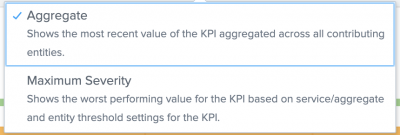
Click the KPI Value dropdown in the Service Analyzer to change the way KPI values are presented.
Aggregate
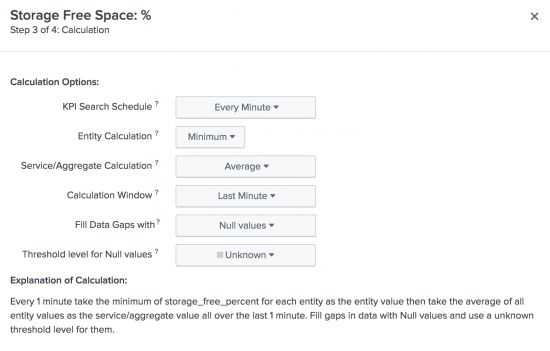
The aggregate value is the most recent value of the KPI as defined in a service's KPI calculation settings. The following image shows an example of the calculation settings for a KPI called Storage Free Space.
In this example, the Service/Aggregate Calculation reports on the average percentage of free space across all contributing entities. The Service Analyzer displays this average value when you select KPI Value: Aggregate in the Service Analyzer.
Maximum Severity
The Maximum Severity view shows the worst performing value for each KPI. It displays one of the following values:
- The value of the worst performing entity for the KPI.
- The aggregated value of all contributing entities, if this value is worse than the value of any single entity.
View maximum severity KPI values to identify which KPI is affecting a service health score the most.
If a KPI is not split by entity, the Aggregate and Maximum Severity values for the KPI are the same.
Example
You have a database service that contains the Storage Free Space KPI. This KPI is split by entity and there are three entities which are hosts: mysql-01, mysql-02, and mysql-03.
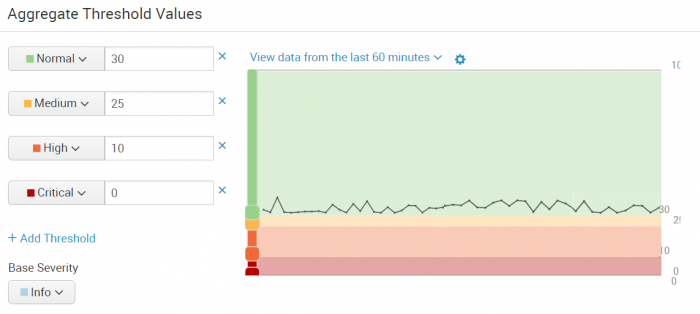
The following image shows the aggregate threshold configuration for the KPI:

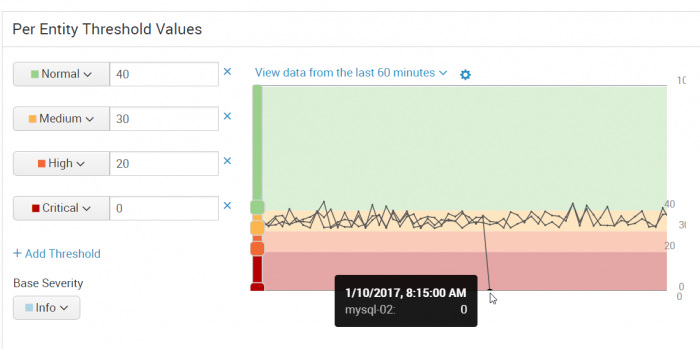
Because it's important to know if any host is running low on disk space, you set entity thresholds to be more sensitive than the aggregate thresholds in the service definition.
The following image shows the per-entity threshold configuration for the KPI:
In this scenario, the mysql-02 host is running critically low on disk space. The database service is showing a high severity level on the Service Analyzer. You want to know which KPIs are responsible for the low health score.
If you use the Aggregate KPI view, the Storage Free Space KPI might be green even though the mysql-02 host is critically low on disk space. This discrepancy occurs because when ITSI aggregates the value of the mysql-02 host with the values of the other two hosts, the aggregate value is still within normal threshold limits.
However, when you switch to the Max Severity KPI view, the KPI tile displays the value of the worst performing entity rather than an aggregated value. The KPI severity changes from green to red and the value of the KPI adjusts to reflect the alert value for the mysql-02 host.
Now that you've identified the KPI that is most likely responsible for the degraded health score of the database service, you can select the KPI tile to see which entity for the Storage Free Space KPI is lowest on disk space.
| Apply anomaly detection to a KPI in ITSI | Overview of service templates in ITSI |
This documentation applies to the following versions of Splunk® IT Service Intelligence: 4.11.0, 4.11.1, 4.11.2, 4.11.3, 4.11.4, 4.11.5, 4.11.6, 4.12.0 Cloud only, 4.12.1 Cloud only, 4.12.2 Cloud only, 4.13.0, 4.13.1, 4.13.2, 4.13.3, 4.14.0 Cloud only, 4.14.1 Cloud only, 4.14.2 Cloud only, 4.15.0, 4.15.1, 4.15.2, 4.15.3, 4.16.0 Cloud only, 4.17.0, 4.17.1, 4.18.0, 4.18.1, 4.19.0, 4.19.1, 4.19.2, 4.19.3, 4.19.4, 4.20.0, 4.20.1


 Download manual
Feedback submitted, thanks!