Add entity and anomaly overlays to a deep dive in ITSI
Overlays in a deep dive can show you more detailed information about a KPI that's not always obvious from the aggregate KPI value. Entity overlays let you see how specific entities are performing relative to others and to the aggregate value. Anomaly overlays let you see statistical outliers in KPI search results.
Add entity overlays
Entity overlays display KPI search results for individual entities over the aggregate search results in a KPI lane. If a KPI is split by entity, you can use entity overlays to compare how individual entities are performing relative to other contributing entities, and to the aggregate KPI value. For details on how to configure per-entity thresholds, see Set per-entity thresholds.
The following image shows an example of entity overlays. The aggregate KPI value is plotted in black and the individual entities are plotted in yellow, red, and green:
- Click the gear icon
 in the KPI lane and select Lane Overlay Options.
 - Click Yes to enable overlays.
- Configure the following fields:
Field Description Overlay Type EntityGraph color The color of the entity line graph. If you choose Automatic, each entity is given a different color. Overlay Selection Mode Choose Static to select the specific entities to show as lane overlays. Choose Dynamic to automatically render the three worst performers as lane overlays. - If you chose Static, select the entities to include in the overlay.
- Click Save. The entity overlays appear within the KPI lane.
Turn entity overlays into swimlanes
You can convert all entities contributing to a KPI into individual entity lanes within a deep dive. Break out entities into individual lanes to view their values over time and more easily see how they're contributing to the aggregate KPI value.
- Add entity overlays as shown in Add entity overlays above.
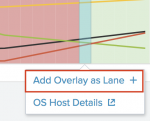
- Click in the KPI lane and select Add Overlay as Lane. All entity overlays in the KPI lane appear in individual lanes.

The following example shows how entity lanes can help you troubleshoot an outage. While it's difficult to detect a problem by simply looking at the parent KPI lane, the entity lanes clearly show that mysql-02 went down around 6AM:
Entity lanes function like KPI lanes. After you add them to the deep dive you can perform additional configurations, such as changing the graph rendering options or configuring the lane color or size. For more information, see Configure KPI lanes in a deep dive in ITSI.
Drill down to module details
ITSI modules populate services with specific entity rules and pre-builts KPIs. When you view one of those KPIs in a deep dive, you can drill down to the module entity dashboard. For more information about the modules delivered with ITSI, see Overview of modules in ITSI in the Modules manual.
- Add entity overlays as shown in Add entity and anomaly overlays to a deep dive above.
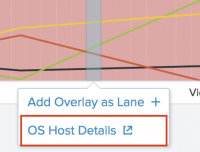
- Click on the entity overlay graph to display the drilldown menu.
- Select the module drilldown option. For example, OS Host Details. This opens the OS Host Details dashboard inside ITSI.
Add anomaly overlays
ITSI provides anomaly detection algorithms that detect statistical outliers in KPI search results. Anomaly overlays let you view these outliers and track anomalous trends in your KPI data.
For more information, see Apply anomaly detection to a KPI in ITSI.
- Click the gear icon in the KPI lane and select Lane Overlay Options.
- Enable overlays.
- For Overlay Type choose Anomaly.
- Click Save. Anomalies detected in the current time range appear as red circles in the KPI lane:

- Select an anomaly flag to view event details, or to add a new anomaly overlay lane to the deep dive.
| Compare search results from different time ranges in an ITSI deep dive | Create a multi-KPI alert from a deep dive in ITSI |
This documentation applies to the following versions of Splunk® IT Service Intelligence: 4.11.0, 4.11.1, 4.11.2, 4.11.3, 4.11.4, 4.11.5, 4.11.6, 4.12.0 Cloud only, 4.12.1 Cloud only, 4.12.2 Cloud only, 4.13.0, 4.13.1, 4.13.2, 4.13.3, 4.14.0 Cloud only, 4.14.1 Cloud only, 4.14.2 Cloud only, 4.15.0, 4.15.1, 4.15.2, 4.15.3, 4.16.0 Cloud only, 4.17.0, 4.17.1, 4.18.0, 4.18.1, 4.19.0, 4.19.1, 4.19.2, 4.19.3, 4.19.4, 4.20.0, 4.20.1


 Download manual
Feedback submitted, thanks!