Predict Numeric Fields Experiment Assistant workflow
The Predict Numeric Fields Experiment Assistant uses regression algorithms to predict numeric values from other fields in the event. Use regression models to determine to what extent certain peripheral factors contribute to a particular metric result.
The following visualization illustrates a scatter plot of the actual versus predicted results. This visualization is from the Showcase example for Server Power Consumption.

Available algorithms
The Predict Numeric Fields Experiment Assistant uses the following algorithms:
Create an Experiment to predict a numeric field
Experiments bring all aspects of a monitored machine learning pipeline into one interface with automated model versioning and lineage built in. After the Experiment Assistant computes the regression model, use these peripheral values to make a prediction on the metric result.
Before you begin
- The Predict Numeric Fields Assistant offers the option to preprocess your data. For more information on Assistant-based preprocessing algorithms, see Preprocessing machine data using Assistants.
- The MLTK default selects the Linear Regression algorithm. Use this default if you aren't sure which algorithm is best for you. For further details on any algorithm, see Algorithms in the Machine Learning Toolkit.
Assistant workflow
Follow these steps to create a Predict Numeric Fields Experiment.
- From the MLTK navigation bar, click Experiments.
- If this is the first Experiment in the MLTK, you will land on a display screen of all six Assistants. Select the Predict Numeric Fields block.
- If you have at least one Experiment in the MLTK, you will land on a list view of Experiments. Click the Create New Experiment button.
- Fill in an Experiment Title, and add a description. Both the name and description can be edited later if needed.
- Click Create.
- Run a search and be sure to select a date range.
- (Optional) Click + Add a step to add preprocessing steps.
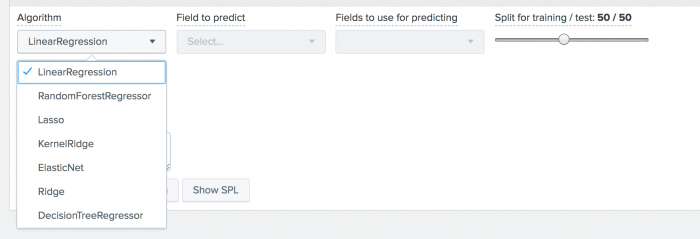
- Select an algorithm from the
Algorithmdrop-down menu. LinearRegression is selected by default. Another algorithm option may better fit your Experiment.
- Select a target field from the drop-down menu
Field to Predict.
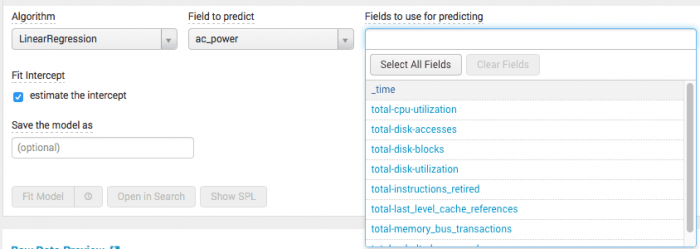
When you select theField to predict, theFields to use for predictingdrop-down menu populates with available fields to include in your model. - Select a combination of fields from the drop-down menu
Fields to use for predicting. In the following server power showcase example, the drop-down menu contains a list of all the possible fields used to predict ac_power using the linear regression algorithm.
- Use the slider bar to split your data into training and testing data. The default split is 50/50, and the data is divided randomly into two groups.
- (Optional) Add notes to this Experiment. Use this free form block of text to track the selections made in the Experiment parameter fields. Refer back to notes to review which parameter combinations yield the best results.
The algorithm you select determines the fields available to build your model. Hover over any field name to get more information about that field.
- Click Fit Model. The Experiment is now in a Draft state.
Draft versions allow you to alter settings without committing or overwriting a saved Experiment. An Experiment is not stored to Splunk until it is saved.
The following table explains the differences between a draft and saved Experiment:Action Draft Experiment Saved Experiment Create new record in Experiment history Yes No Run Experiment search jobs Yes No (As applicable) Save and update Experiment model No Yes (As applicable) Update all Experiment alerts No Yes (As applicable) Update Experiment scheduled trainings No Yes


Interpret and validate results
After you fit the model, review the prediction results and visualizations to see how well the model predicted the numeric field. Results are based on your testing data. You can use the following methods to evaluate your predictions:
Charts and Results Applications Actual vs. Predicted Scatter Chart This visualization plots the predicted value against the raw actual values for the predicted field. The closer the points are to the line, the better the model. Hover over the blue dots to see actual values. Residuals Histogram This visualization shows the difference between the actual values and the predicted values. Hover over the predicted values (blue bars) to see the number of residual errors and the sample count values. Residuals commonly end on a bell curve clustered tightly around zero. R2 Statistic This statistic shows how well the model explains the variability of the result. 100% (a value of 1) means the model fits perfectly. The closer the value is to 1, the better the result. Root Mean Squared Error This chart shows the variability of the result, which is the standard deviation of the residual. The formula takes the difference between the actual and predicted values, squares this value, takes an average, and then takes a square root. This value can be arbitrarily large and just gives you an idea of how close or far the model is. These values only make sense within one dataset and shouldn't be compared across datasets. Fit Model Parameters Summary This summary displays the coefficients associated with each variable in the regression model. A relatively high coefficient value shows a high association of that variable with the result. A negative value shows a negative correlation. Actual vs. Predicted Overlay This overlay shows the actual values against the predicted values, in sequence. Residuals The residuals show the difference between predicted and actual values, in sequence.
Refine the Experiment
After you validate the results, refine the Experiment and run the fit command again. Optionally choose to track your changes in the Notes text field.
Consider the following options to better refine your Experiment:
- Reduce the number of fields selected in the
Fields to use for predictingdrop-down menu. Having too many fields can generate a distraction. - Bring in new data sources to enrich your modeling space.
- Build features on raw data, model on behaviors of the data instead of raw data points, using SPL, Streamstats, or eventstats.
- Check your fields to ensure you are using categorical values correctly. For example are you using DayOfWeek as a number (0 to 6) instead of as "Monday", "Tuesday", and so forth? Make sure you have the right type of value for categorical fields.
- Bring in context via lookups - holidays, external anomalies, etc.
- Increase the number of fields (from additional data, feature building as above, etc) selected in the
Fields to use for predictingdrop-down menu.
Use the Experiment History tab to review settings and changes made as you refine the model.
The history of any scheduled model retraining is captured in the Experiment History tab.
Save the Experiment
Once you are getting valuable results from your Experiment, save it. Saving your Experiment results in the following actions:
- Assistant settings saved as an Experiment knowledge object.
- The Draft version saves to the Experiment Listings page.
- Any affiliated scheduled trainings and alerts update to synchronize with the search SPL and trigger conditions.
You can load a saved Experiment by clicking the Experiment name.
Deploy the Experiment
Saved predict numeric fields Experiments include options to manage and publish.
Within the Experiment framework
From within the framework, you can both manage and publish your Experiments. To manage your Experiment, perform the following steps:
- From the MLTK navigation bar, choose Experiments. A list of your saved Experiments populates.
- Click the Manage drop-down menu which is available in the Actions column.

The toolkit supports the following Experiment management options:
- Create and manage Experiment-level alerts. Choose from both Splunk platform standard trigger conditions, as well as from Machine Learning Conditions related to the Experiment.
- Edit the title and description of the Experiment.
- Schedule a training job for an Experiment.
- Delete an Experiment.
Updating a saved Experiment can affect affiliates alerts. Re-validate your alerts once you complete the changes. For more information about alerts, see Getting started with alerts in the Splunk Enterprise Alerting Manual.
You can publish your Experiment through the following steps:
- From the MLTK navigation bar, choose Experiments. A list of your saved Experiments populates.
- Click the Publish button available under the Actions column.
Publishing an Experiment model means the main model and any associated preprocessing models will be copied as lookup files in the user's namespace within a selected destination app. Published models can be used to create alerts or schedule model trainings.
The Publish link will only show if you have created the Experiment and fit the model.
- Give the model a title. It must start with letter or underscore, and only have letters, numbers, and underscores in the name.
- Select the destination app.
- Click Save.
- A message will let you know whether the model published or why the action was not completed.
Experiments are always stored under the user's namespace, so changing sharing settings and permissions on Experiments is not supported.
Outside the Experiment framework
- Click Open in Search to generate a New Search tab for this same dataset. This new search opens in a new browser tab, away from the Assistant.
This search query uses all data, not just the training set. You can adjust the SPL directly and see the results immediately. You can also save the query as a Report, Dashboard Panel or Alert. - Click Show SPL to open a new modal window/ overlay showing the search query you used to fit the model. Copy the SPL to use in other aspects of your Splunk instance.
Learn more
To learn about implementing analytics and data science projects using Splunk's statistics, machine learning, and built-in custom visualization capabilities, see the Splunk Education course of Splunk for Analytics and Data Science.
| Smart Prediction Assistant | Predict Categorical Fields Experiment Assistant workflow |
This documentation applies to the following versions of Splunk® Machine Learning Toolkit: 4.4.0, 4.4.1, 4.4.2, 4.5.0, 5.0.0, 5.1.0, 5.2.0, 5.2.1, 5.2.2, 5.3.0, 5.3.1
Feedback submitted, thanks!