Windows Overview
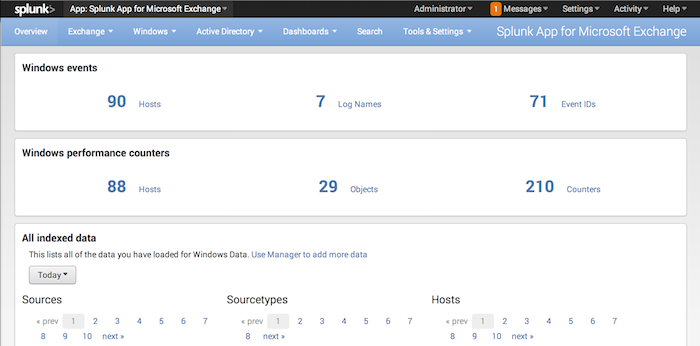
The Overview dashboard contains three panels: Windows events, Windows performance counters and All indexed data.
The "Windows events" panel has counters for numbers of hosts, log names, and event IDs. The "Windows performance counters" panel has counters for numbers of hosts, performance objects, and performance counters.
Windows events: Provides information on the number of hosts from which event log data is being collected, the number of event logs and number of event IDs.
Windows performance counters: Provides information on the number of hosts from which performance data is being collected, number of objects and total number of counters.
All indexed data: Provides a chronologically-sorted list of the sources, source types, and hosts that the Splunk App for Windows Infrastructure has collected data on.
How to use this page
- You can control how much data this panel displays by clicking the time picker and choosing one of the available range presets or selecting a custom time range.
- You can click on the "Windows events" and "Windows performance counters" links. The Splunk App for Windows Infrastructure takes you to a Search page that lists all of the events found for that particular counter.
| Perfmon | Event Monitoring |
This documentation applies to the following versions of Splunk® App for Windows Infrastructure (EOL): 1.4.1, 1.4.2, 1.4.3, 1.4.4, 1.5.0, 1.5.1, 1.5.2, 2.0.0, 2.0.1, 2.0.2, 2.0.3, 2.0.4

 Download manual
Feedback submitted, thanks!