Perfmon
This topic discusses the Perfmon page, which you access from the Host Inventory page by clicking a sparkline on that page.
Overview
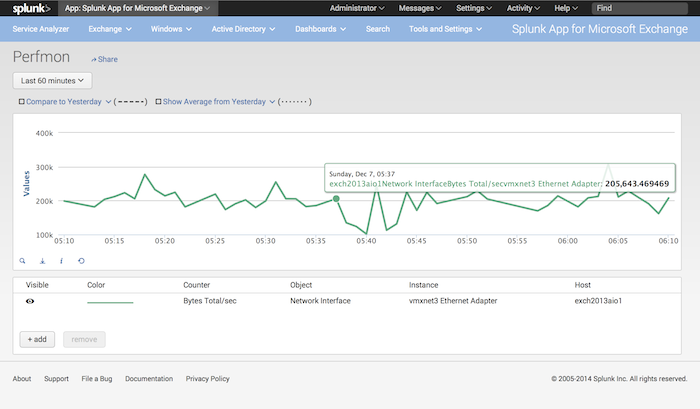
The Perfmon page shows a graph that charts performance of one or more performance counters associated with an Exchange host or service. The page lets you view performance metrics, compare metrics from a point in the past, and show an average of the metric from a specific point in the past.
The page provides a list of counters and allows you to add and remove existing counters from the display graph.
How to use this page
Change the time range
To change the time range, click the time picker and choose a value that suits your needs. Once you have, click Apply. The Splunk App for Microsoft Exchange updates the page based on the new time range.
View data points
The Perfmon page displays lines based on the data it has collected for the selected counter during the time period shown in the time picker. To see the individual data points, mouse over the line in the chart. A pop-up window shows the date, counter, object, instance, and host name, and the value at the cursor position.
Compare data to previous points in time and average over time
Use the "Compare to" and "Show Average from" controls to compare current data points to data points recorded at a point of time in the past or an average from a previous time.
1 To see the previous or average data points, click the checkbox next to "Compare to…" or "Show Average from…" The Splunk App for Microsoft Exchange updates the graph to show the data points.
2. To set the point in time to compare, click either "Compare to…" or "Show Average from…" A mini time picker window appears.
3a. Select an entry in the "End date and time" picker. Or,
3b. Enter a date and time in the past and click Apply. The Splunk App for Microsoft Exchange updates to include a dashed line (for comparing to a certain point in the past) or a dotted line (for comparing the average from a certain point in the past.)
4. Compare these data points to the current data point (the solid line.)
Control visible data points and add and remove lines
You can control the state of Performance Monitor data on this page by using the controls in the lower portion of the panel:
- Click the eye icon next to a performance counter to toggle its visibility in the chart.
- Click the + add button to add performance counters to the graph. The Splunk App for Microsoft Exchange loads the "Select Performance Counters" dialog where you can add available counters for hosts. See "Select performance counters" later in this topic.
- To remove a counter, select it in the list and click the remove button.
Select performance counters
The "Select Performance Counters" dialog lets you add performance counters for items that have been collected with the Splunk Add-on for Windows.
1. Select the host that you want to see available counters for in the list.
2. In the Available Counters field, click a counter once to expand it and show the associated objects with it.
3. Click an object to display the available instances.
4. Click the desired instance.
5. Click the gray -> button to move the instance from the "Available Counters" field to the Selected Counters field.
6. Repeat this process for additional counters, if desired.
7. Click Save. The Splunk App for Microsoft Exchange updates the page with the new counter.
To share the Perfmon page in its current state, click the Share link. The Splunk App for Microsoft Exchange displays a link that you can copy and paste into an email message or chat window.
| Change thresholds | Host Performance Reports |
This documentation applies to the following versions of Splunk® App for Microsoft Exchange (EOL): 3.4.0

 Download manual
Feedback submitted, thanks!