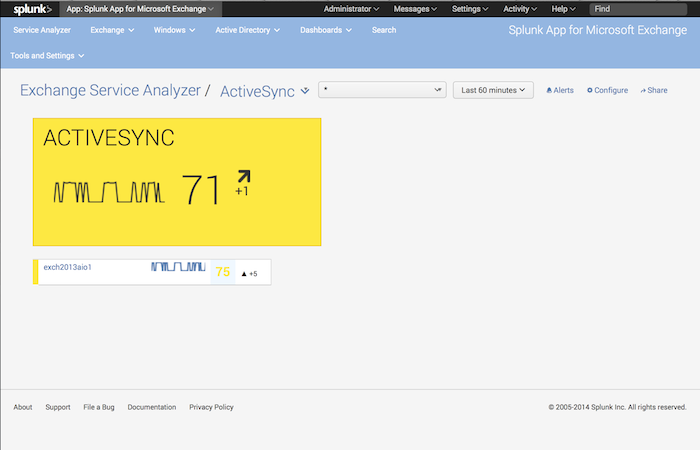
Service Health page
This page provides information about the Service Health page, which you access when you click on a tile on the Service Analyzer page.
Description
The Service Health page contains:
- A representation of the tile that you clicked on from the Service Analyzer window to get to this page
- A list of all hosts that participate in the current Exchange service group.
The properties for the tile are the exact same as they are on the Service Analyzer page. See "Exchange service tiles."
Host entry
Each entry in the list of hosts has the following properties:
- A color stripe that represents the current status of the host.
- The host name.
- A sparkline that depicts the current overall health of the host as well as its status over the amount of time shown in the time picker at the top of the page.
- A number that represents the overall health - or Key Application Score (KAS) of the host.
- A number that shows the latest trend of the overall health of the host over the amount of time shown in the time picker at the top of the page.
Like the service tile, the host entry color band changes from green to yellow or red based on the following criteria:
- All components of a host must represent as green before the host itself can represent as green.
- If any component on a server represents yellow or red, then the host itself also represents as yellow or red.
- Hosts that have components that host as both yellow and red will themselves represent as red.
- The host color does not change based on the KAS.
How to use this page
Get more info about a host
To learn more about a host, click on the host name in the list of hosts. The Splunk App for Microsoft Exchange loads the Component Health page for that host. See "Component Health page."
Choose a service
You do not need to return to the Service Analyzer page to see information about another Exchange service. You can click on the service name ext to "Exchange Service Analyzer" to get a drop down list that shows all of the services that are on the Service Analyzer page.
Host filter
Click the Host Filter drop-down to see a list of hosts that participate in this service group. You can also click * to see a list of all hosts in the group.
Choose a time range
You can control the time range that the Service Health window uses by clicking the time-range picker next to the Host Filter drop-down.
Alerts and Sharing
To learn how to create new alerts or modify existing alerts for the Splunk App for Microsoft Exchange, click Alerts.
To share the Service Health page in its current state, click Share. The Splunk App for Microsoft Exchange opens a window and shows a link you can copy and paste into an email message or communication window.
Configure the Service Health page
To configure the Service Health page and determine which hosts participate in this service group, click Configure. The Splunk App for Microsoft Exchange opens the "Configure service" page and shows all hosts that participate in the service (under "Enabled Hosts") and any hosts that do not participate (under "Disabled Hosts").
1. To scan for any new hosts, click the Scan New Hosts button.
2. To enable a host as part of this service, click the host in the "Disabled Hosts" pane, then click the left arrow button between the two panes. The Splunk App for Microsoft Exchange moves the host to the "Enabled Hosts" pane.
3. To disable a host, click the host in the "Enabled Hosts" pane, then click the right arrow button between the two panes. The Splunk App for Microsoft Exchange moves the host to the "Disabled Hosts" pane.
4. Click the Save button to save your changes.
| Service Analyzer | Component health page |
This documentation applies to the following versions of Splunk® App for Microsoft Exchange (EOL): 3.4.0


 Download manual
Feedback submitted, thanks!