Service Analyzer
This topic discusses the Service Analyzer page and provides instructions on how to use the page.
Main Service Analyzer page
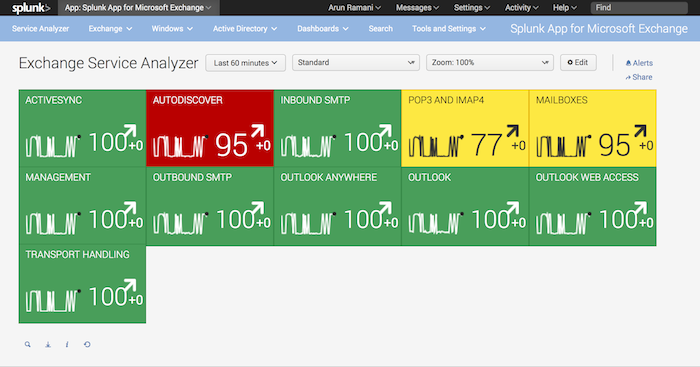
The Service Analyzer page gives you a glance at the state of all of the Exchange services in your Exchange deployment.
Exchange service tiles
On this page, the Splunk App for Microsoft Exchange depicts each Exchange service as a tile. The Splunk App for Microsoft Exchange provides tiles for the following services:
- ActiveSync
- Autodiscover
- Inbound SMTP
- POP3 and IMAP4
- Mailboxes
- Management
- Outbound SMTP
- Outlook Anywhere
- Outlook
- Outlook Web Access
- Transport Handling
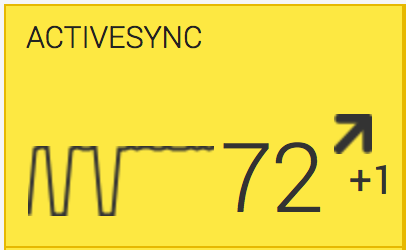
Each tile contains the following:
- The name of the service, in bold letters along the top of the tile
- A spark line that depicts the current overall health of the service, as well as its status over the amount of time shown in the time picker at the top of the page.
- A number that represents the current overall health of the service as defined by Microsoft best practices (the Key Application Score, or KAS), on a scale of 0 to 100.
- A number that shows the most recent trend of the KAS (positive or negative) in the amount of time shown in the time picker at the top of the page.
The tiles represent groups of hosts that participate in a particular Exchange service. When you click on a service tile, the Splunk App for Microsoft Exchange loads the service health page for that service, which contains the hosts that participate in that service. See "Service health page."
On the service health page, you can click on a host in the list to load the component health page. See "Component health page."
Each of these tiles also has a color. The color can be green, yellow, red, or gray, and changes based on the state of the service.
Color meanings
Each service tile can be one of four colors, and gives you an indication of the health of the service based on the color:
- Green: OK. This means that the object currently operates within the thresholds determined by Microsoft to be within nominal limits for the object.
- Yellow: Warning. This means that the object currently operates outside of nominal thresholds as defined by Microsoft for the service, but is not yet in a failure state. Objects that show yellow indicate a potential problem that should be addressed before they progress to red.
- Red: Error/Critical. This means that the object currently operates in a state that Microsoft considers to be in error for the service. This indicates a failure scenario and a tile that shows this state indicates a problem that must be addressed immediately.
- Gray: No Data. This means that no data exists for the service. Data for this tile is not coming into the Splunk App for Microsoft Exchange and you should investigate why.
The tiles change color based on these principles:
- All components of a host must represent as green before the host itself can represent as green.
- Additionally, all hosts in an Exchange service must represent as green before the Exchange service itself (the tile) can represent as green.
- If any component on a server represents as yellow or red, then the host itself also represents as yellow or red.
- If any host in an Exchange service represents as red, then the Exchange service also represents as red.
- Hosts that have components that host as both yellow and red will themselves represent as red.
- The tile does not change color based on the KAS - that number is independent of tile color.
How to use this page
Get more info about a service
To learn more about the status of a service, click on a service tile. The Splunk App for Microsoft Exchange loads the service health page for that tile. See "Service health page."
Choose a time range
To change the time range that the Service Analyzer uses, click the time picker next to the page title. From the time picker, you can:
- Choose a preset time range - either real time or relative to the present time.
- Choose a time range relevant to the current time (such as seconds, minutes, hours, weeks, days, months, or years up to now.)
- Choose a real-time search.
- Choose a date range. The Splunk App for Microsoft Exchange sets the time range to the beginning of the day for the first date and the end of the day for the second date.
- Choose a date and time range.
- Choose an advanced time range, where you can enter times in various formats like *nix epoch time or relative time notation.
Change the display theme
To modify the display of the Service Analyzer, choose the Display theme drop-down list next to the time picker. You can choose:
- Standard: The default display that the Splunk App for Microsoft Exchange loads.
- Dark: This choice puts the tiles on a dark background and removes the Splunk App for Microsoft Exchange banner.
- Light: Like "Dark," but the tiles float over a lighter background.
Change tile size
The Service Analyzer was designed to be used on large displays. This option lets you control how large the tiles are on screen.
To change the size of the tiles, use the Zoom drop-down list next to the "Display theme" drop-down. You have several choices from the lowest size of 100% to a maximum of 300%. After you choose the new setting, the Splunk App for Microsoft Exchange updates the page to display the resized icons.
Toggle and use Edit Mode
To toggle Edit Mode on the Service Analyzer page and rearrange the service tiles, click the Edit button next to the "Zoom" drop-down.
To relocate a tile while in Edit mode:
1. Click and hold the mouse button over the tile you want to move.
2. While keeping the mouse button held down, drag the tile around to the new location. The other tiles rearrange to create space for the tile that you are moving around.
3. When the tile is at the location you want, release the mouse button.
4. Repeat Steps 1-3 for additional tiles that you want to move.
5. When you are satisfied with how you have arranged all tiles, click Done
Alerts and Sharing
To learn how to create new alerts or modify existing alerts for the Splunk App for Microsoft Exchange, click Alerts.
To share the Service Analyzer page in its current state, click Share. The Splunk App for Microsoft Exchange opens a window and shows a link you can copy and paste into an email message or communication window.
Standard dashboard controls
In this and nearly every other dashboard, you can perform standard operations on the dashboard by clicking the icons at the bottom left of each panel:
- Click the magnifying glass to see the search that created this dashboard in a search window.
- Click the down arrow to export the results to a file.
- Click the italic 'i' to open the search job inspector.
- Click the refresh arrow to refresh the page.
| About this manual | Service Health page |
This documentation applies to the following versions of Splunk® App for Microsoft Exchange (EOL): 3.4.0


 Download manual
Feedback submitted, thanks!