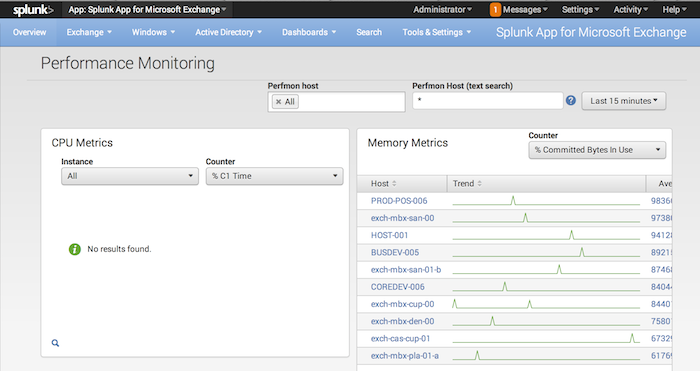
Performance Monitoring
Not to be confused with the Perfmon page.
This topic discusses the "Performance Monitoring" page.
Overview
The Performance Monitoring page contains dashboards for CPU, Memory, Physical Disk, Logical Disk, Network Interface, and System metrics.
How to use this page
You can customize the data that appears in the panels by selecting different counters and instances. You can also drill into specifics on memory, CPU, disk and network traffic by host, process, and user.
The dashboard also provides a list of useful reports at the bottom of the page. These reports can be used as a guide to customize new reports as you see fit.
Filter performance metrics
Each of the drop downs in the dashboards on the Performance Monitoring page is also a text box. You can click your mouse on any drop down box on the page to enter text into that box. The Splunk App for Windows immediately filters the collected performance metrics to show only entries that match what you type into any of the boxes.
Requirements
The dashboards on this page require the following inputs to display data:
- CPU Metrics: Requires Performance monitoring input "Processor".
- Memory Metrics: Requires Performance monitoring input "Memory".
- Physical Disk Metrics: Requires Performance monitoring input "PhysicalDisk".
- Logical Disk Metrics: Requires Performance monitoring input "LogicalDisk".
- Network Metrics: Requires Performance monitoring input "Network Interface".
- System Metrics: Requires Performance monitoring input "System".
| Event Monitoring | Application Crashes |
This documentation applies to the following versions of Splunk® App for Microsoft Exchange (EOL): 3.4.0

 Download manual
Feedback submitted, thanks!