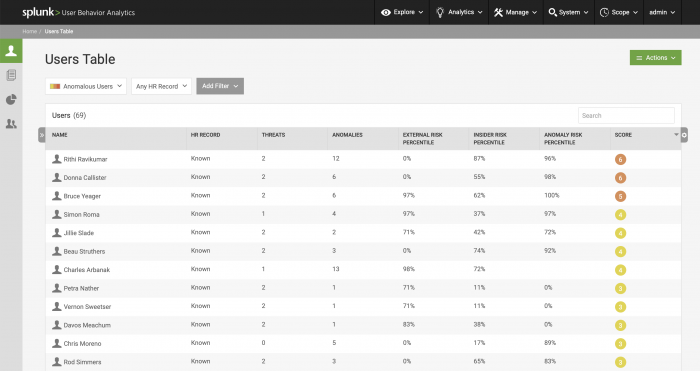
See all users on the User Table
The Users Table provides a view of all users and accounts in your network. From the Splunk UBA navigation menu select Explore > Users to view the table.
By default, the table displays only those users and accounts with anomalous activity in your network. Use the filter options to view All Users instead.
The table shows the user's name or account's login ID, whether or not their HR record is known or unknown by Splunk UBA, associated anomalies, associated threats, the external and insider risk percentiles of the user or account, the date and time when the account was last updated, and a risk score. Select any row to View user information for the selected user or account.
Users are based on HR data and can have multiple user accounts associated with them, visible on the User Accounts page.
Splunk UBA combines Human Resources (HR) data with Active Directory (AD) data to define users. You need HR data and AD data to see both users and accounts. Without HR data, only accounts display.
For more information, see Why Splunk UBA requires HR data.
| Use event drilldown to review an anomaly's raw events | See all devices on the Devices Table |
This documentation applies to the following versions of Splunk® User Behavior Analytics: 5.1.0, 5.1.0.1, 5.2.0, 5.2.1, 5.3.0, 5.4.0, 5.4.1, 5.4.1.1, 5.4.2, 5.4.3

 Download manual
Feedback submitted, thanks!