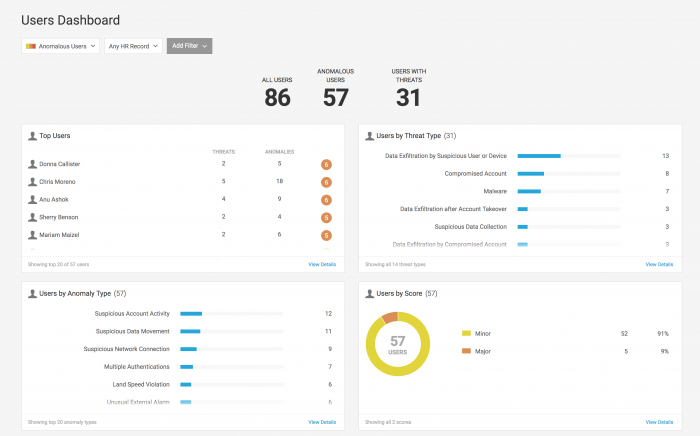
Review overall user activity
Get an overview of user activity in your environment on the Users Dashboard. You can focus on users from any time and of any risk score, or you can select Add Filter to focus on specific types of user.
By default, the Users Dashboard displays users with identified anomalies. You can use the filter to switch the view to All Users.
Complete these steps to access the Users Dashboard:
- Select the Users indicator on the home page, or select Explore > Users from the menu.
- Select the Users Dashboard
 icon.
icon.
Use the dashboard panels to see which users are posing the most risk to your environment, and which threats and anomalies are most common:
| Panel name | Description |
|---|---|
| Top Users | Shows the top twenty highest-risk users and accounts in your environment, sorted by risk score. You can view the number of anomalies and threats associated with each user or account. Click a user to view the User Info for them. Click View Details to see the Users Table filtered by top users. |
| Users by Threat Type | See which threats are most common for users in your organization. Click a threat to see the Users Table with all the users associated with that threat listed, or click View Details to see All Users. |
| Users by Anomaly Type | See which anomalous activity is performed most often by users in your environment. |
| Users by Watchlist | If you have a watchlist set up for users, and those users have anomalies associated with them, you can see anomalous user activity sorted by Users by Watchlist. |
| Anomalous Users Trend | Use this panel to identify how the number of anomalous users in your organization changes over time. |
| Unique Users Trend | See the trend of unique users on this panel. |
| Users with Anomalous Sessions | Identify possible correlations between anomalous sessions, users and accounts, threats, and anomalies. |
| Users by Department | Understand whether various user groups have more anomalies than others in the same department. |
| Users by AD Group | Understand whether various user groups have more anomalies than others in the same Active Directory group. |
| Users by Country, Users by State, Users by City |
Determine location-based correlations between users, accounts, and anomalies. |
| Manage the number of threats and anomalies in your environment | Review Peer Groups in Splunk UBA |
This documentation applies to the following versions of Splunk® User Behavior Analytics: 5.1.0, 5.1.0.1, 5.2.0, 5.2.1, 5.3.0, 5.4.0, 5.4.1, 5.4.1.1, 5.4.2, 5.4.3

 Download manual
Feedback submitted, thanks!