Scenario: Kai troubleshoots a server failure using the Kubernetes navigator 🔗
The following scenario features an example from Buttercup Games, a fictitious e-commerce company.
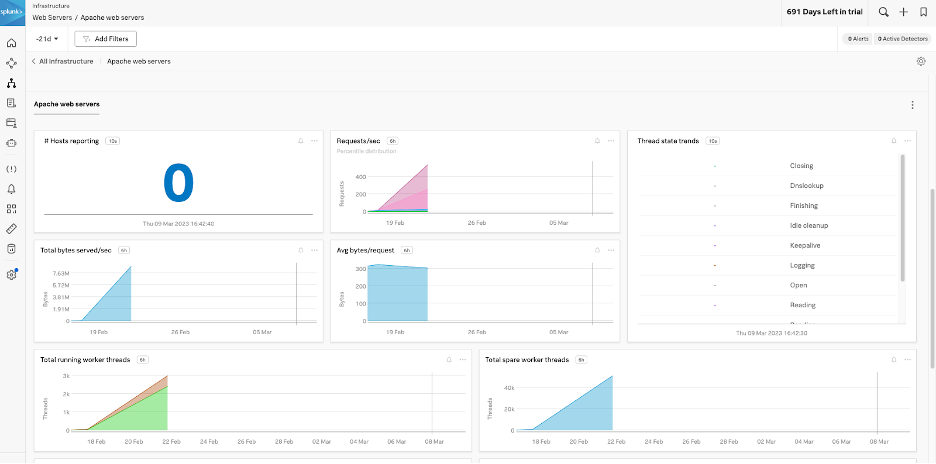
Kai, a site reliability engineer (SRE) at Buttercup Games, is responsible for monitoring web servers in their Kubernetes environment. For the past hour, Kai has noticed that the Apache web servers have stopped showing data in Splunk Observability Cloud. Because all other web servers are still sending in data, Kai suspects that the issue is specific to Apache.
Examine service dependencies 🔗
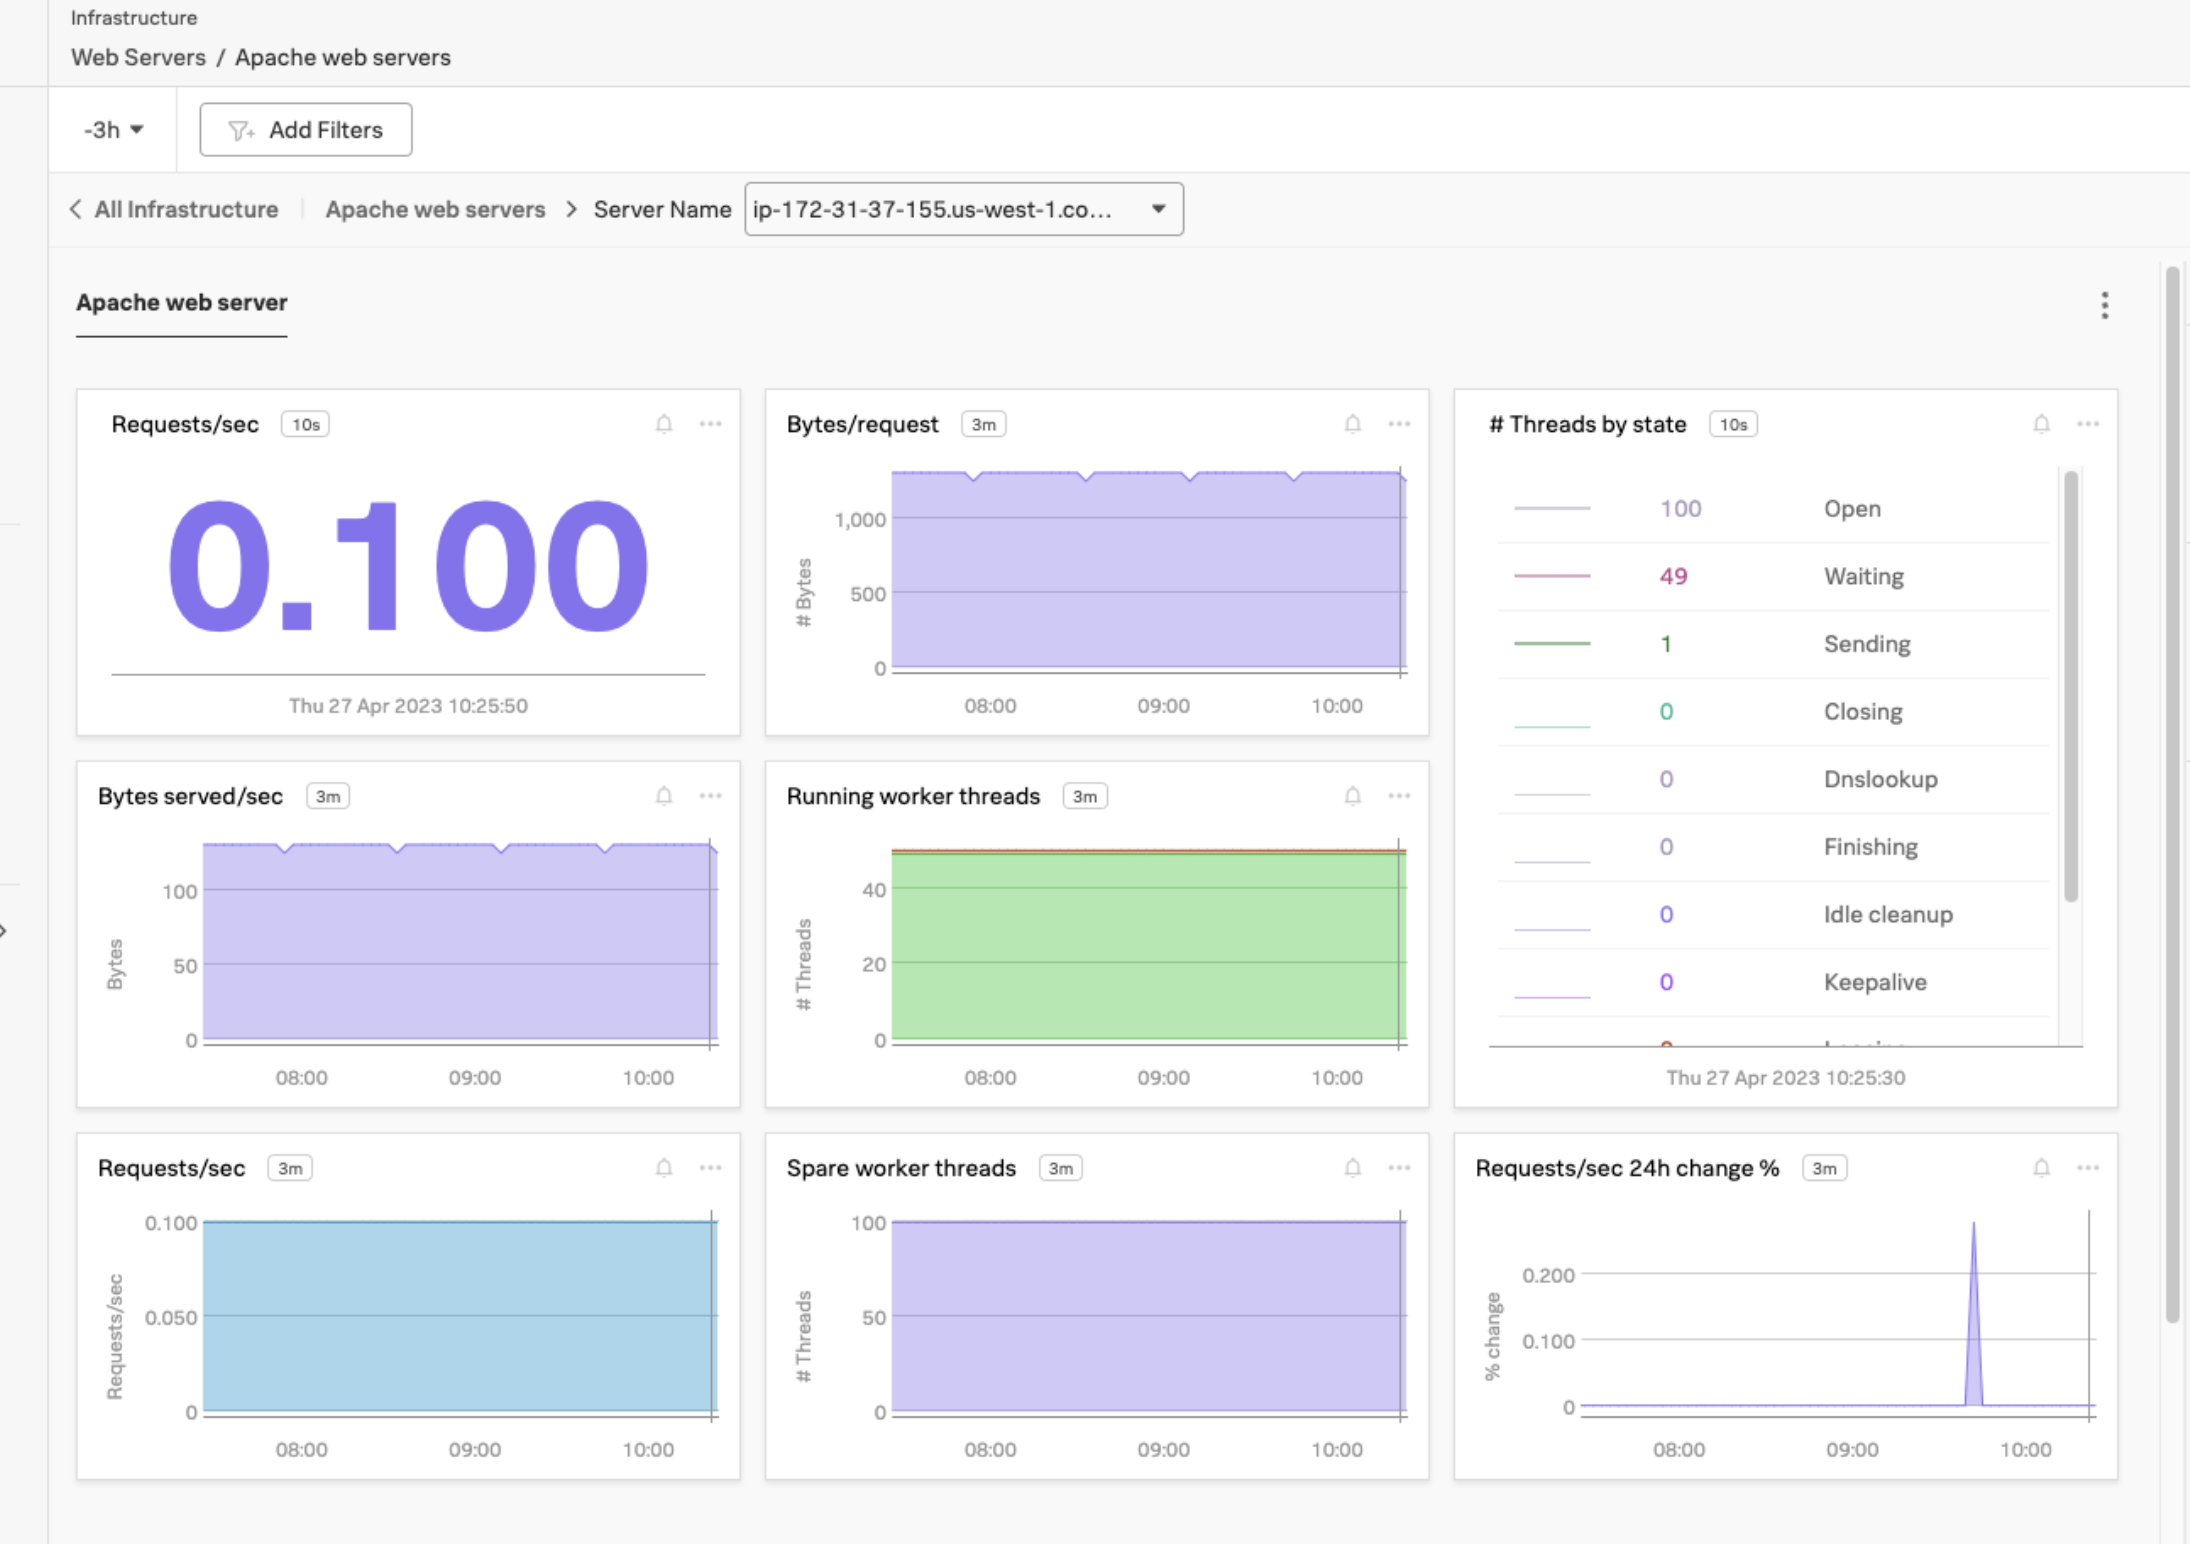
To further investigate, Kai examines the service dependencies for Apache.
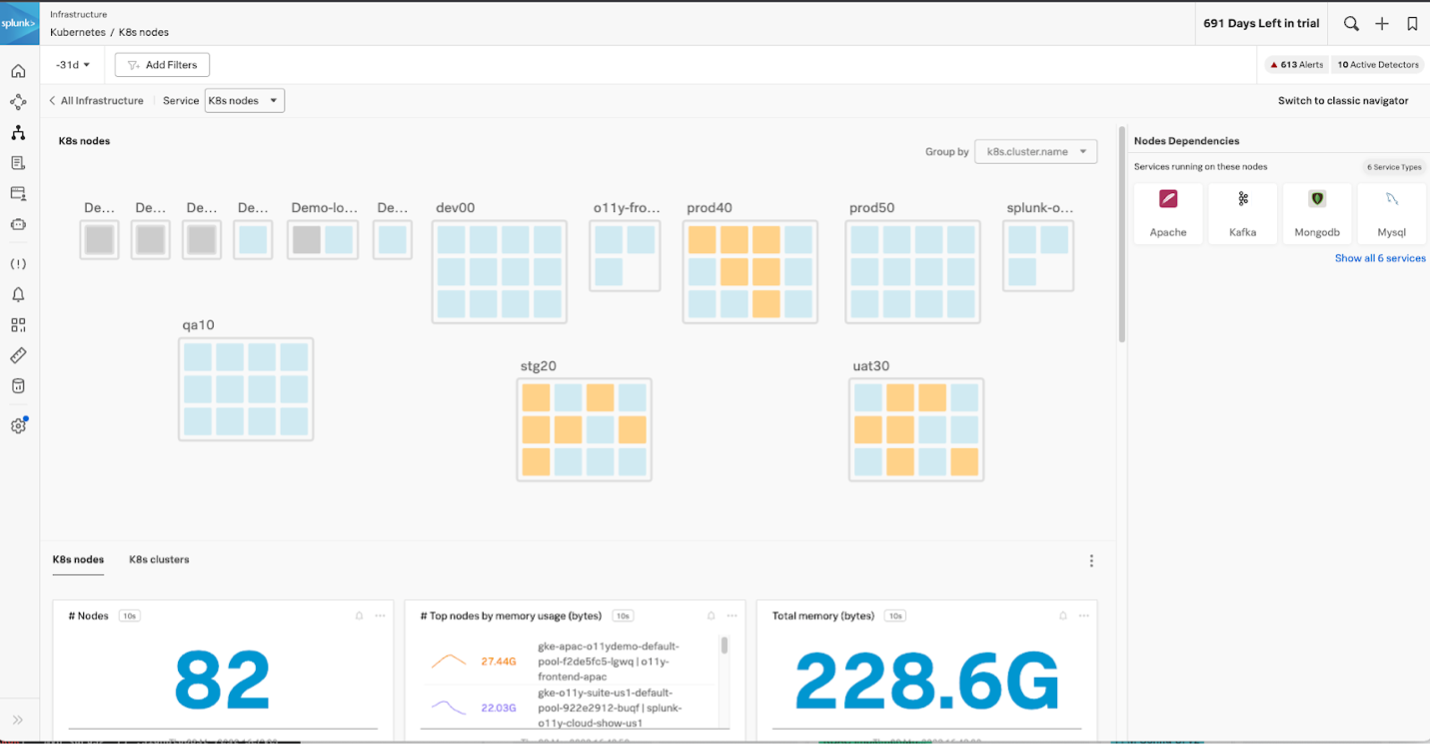
Kai switches from the Apache navigator to the Kubernetes nodes navigator and immediately notices that some Kubernetes pods do not appear to be running.
Isolate the problem area 🔗
Using the hierarchical map, Kai drills down into the appropriate cluster and identifies the node with a failing pod. Kai can see that the pod is in a failed state.

With the help of the Splunk Observability account team, Kai is able identify that the Pending pod has its memory limits configured incorrectly, and therefore can’t start.
Update configuration to resolve pod failure 🔗
Now that Kai knows the root cause of the server failure, they update the Kubernetes configuration and restart the pod. Kai verifies that the pod is running, and that their Apache dashboards are showing incoming data again.
Summary 🔗
Kai used Splunk Observability Cloud to monitor web servers in a Kubernetes environment, and recognized a lack of data coming from Apache servers. Kai then opened Kubernetes Navigator, also called K8s Navigator, to help diagnose that problem and recognized a defective pod in the color-coded visualization provided by the navigator interface. They drilled down to the individual pod, spoke with the Splunk account team about parameters shown there, and determined that an incorrect memory limit had caused failure. When Kai updated the configuration and restarted the pod, the system worked again as designed.
Learn more 🔗
Learn about sending data to Splunk Observability Cloud in Get data into Splunk Observability Cloud.
For an overview of navigators in Splunk Infrastructure Monitoring, see Use navigators in Splunk Infrastructure Monitoring .