Monitoring service dependencies with network map 🔗
The Network Explorer network map is a visualization of traffic activities and service dependencies in your network. You can view the network map in all Network Explorer navigators, and use the map to switch between Network Explorer navigators.
Components in the network map 🔗
The network map consists of the following components.
Component
Definition
Description
Network workload
A service in your network.
Network workloads are represented as circles.
The names for these services come from your Kubernetes environment, Docker metadata, Linux service managers, such as systemd, DNS, and IP address data.
Network edge
The amount of TCP network traffic from a source to a destination workload.
Network edges are represented as broken arrows connecting the circles.
The arrow direction corresponds to the network traffic direction.
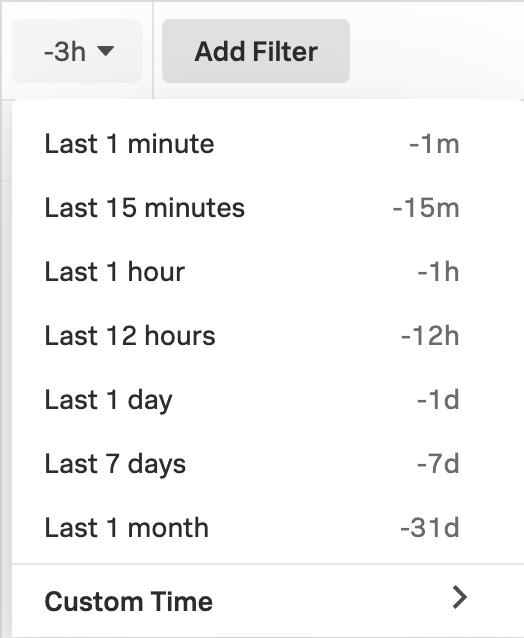
Each arrow has a number indicating the amount of data coming from a source network workload to a destination network workload in a certain time period. By default, the time period is the past 3 hours.
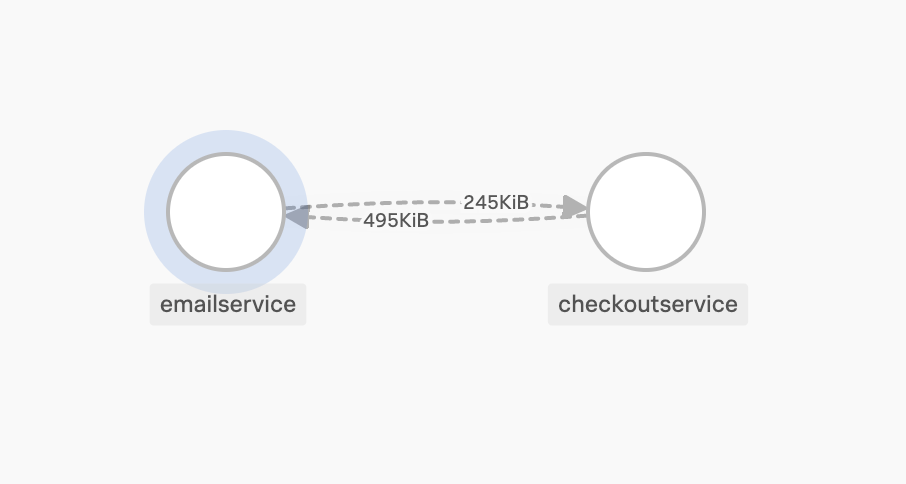
For example, the following network map shows traffic between the emailservice network workload and the checkoutservice network workload in both directions. The emailservice network workload sends 245 KiB of data to checkoutservice, and receives 495 KiB of data from checkoutservice for the past 3 hours.
Drill down into specific connections 🔗
You can view connections related to a network workload or network edge by selecting it on the network map.
When you select a network workload, you get a drilldown map that shows only network edges and network workloads connected to the selected network workload.
For example, the following drilldown map shows the selected
productcatalogservicenetwork workload along with its connected network workloads, and all network edges coming to and fromproductcatalogservice.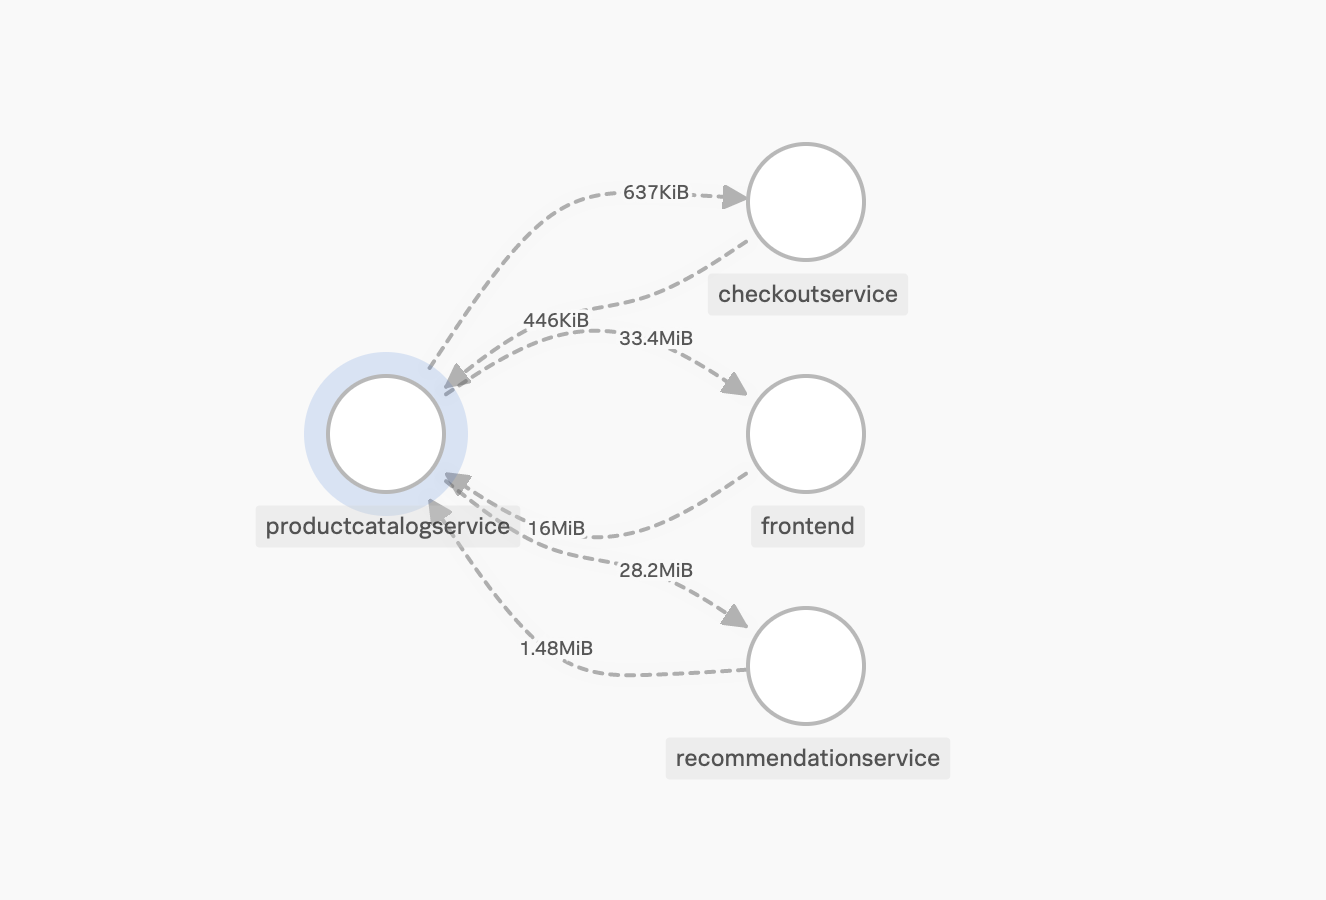
When you select a network edge, you get a drilldown map that shows only two network workloads connected by the selected network edge.
For example, the following drilldown map shows the selected network edge along with the source network workload
prometheus-node-exporterand the destination network workloadkubelet.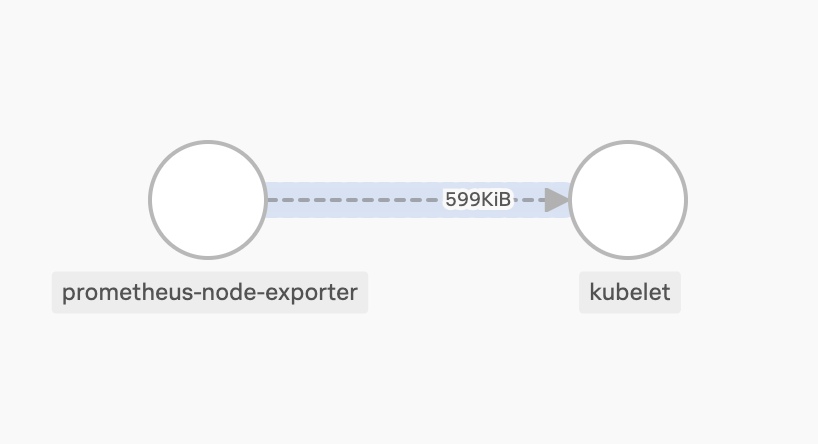
Note
If you are in the Network edge navigator, selecting a network workload opens the Network workload navigator. If you are in the Network workload navigator, selecting a network edge opens the Network edge navigator.
Change time period for network edge data 🔗
By default, a network edge shows the amount of data coming from a source network workload to a network destination workload in the past 3 hours. You can change the time period by selecting a different option, or enter a custom time in the time drop-down menu.