Understand and use the flame graph 🔗
You can visualize aggregated stack traces using the flame graph in AlwaysOn Profiling. The flame graph represents a summary of all stack traces captured from your application. Use the flame graph to discover which lines of code might be causing performance issues, and to confirm whether the changes you make to the code have the intended effect.
Accessing the flame graph 🔗
You can access the flame graph for your instrumented application or service in the following places:
Your Splunk APM service map.
When viewing the details of a span in the trace waterfall view.
The Splunk APM landing page.
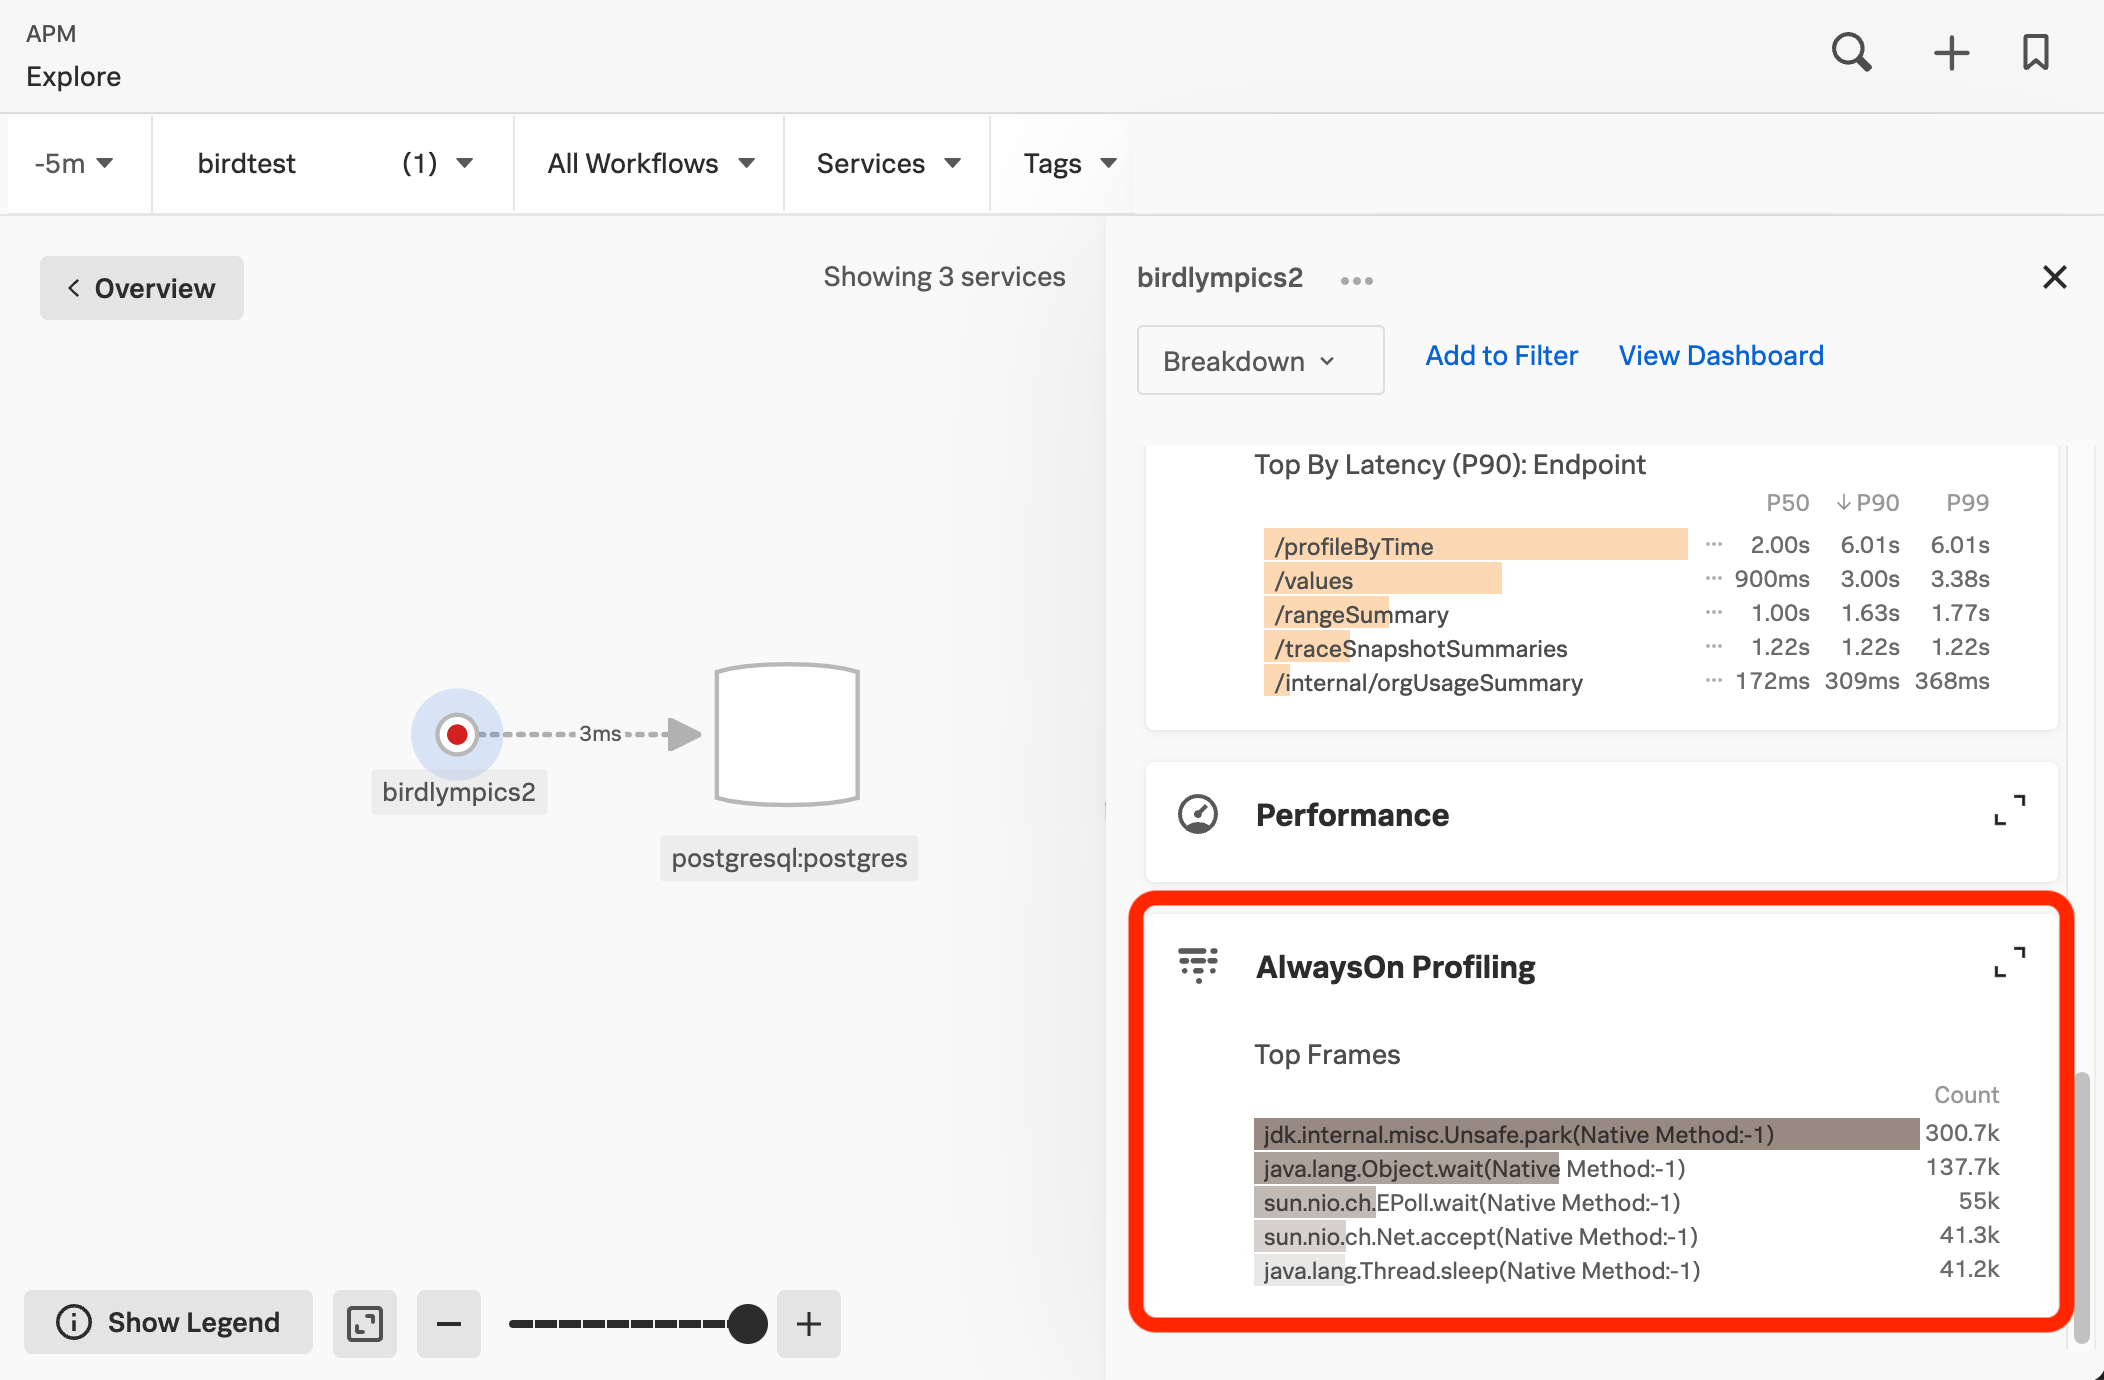
To access the flame graph for your instrumented application or service in Splunk APM, select a service and then select the AlwaysOn Profiling section of the details panel.
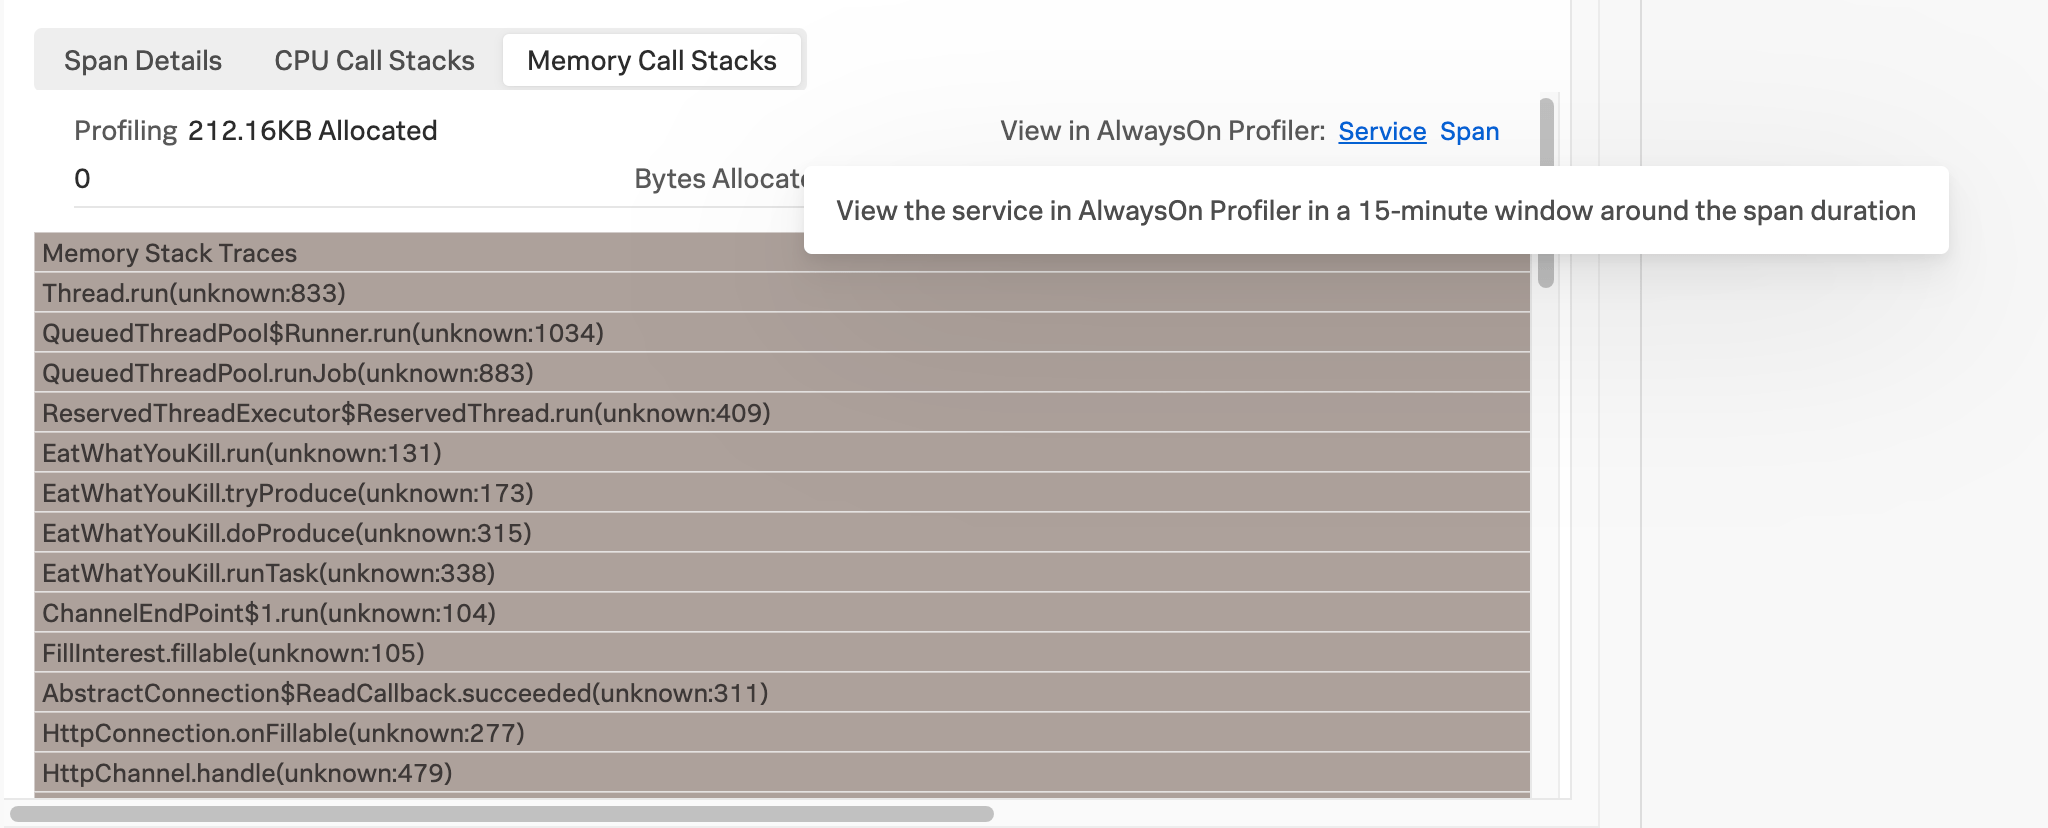
When viewing the details of a span in the trace waterfall view in Splunk APM, select View in AlwaysOn Profiler to open the flame graph for a 10-minute window around the span duration.
You can also select AlwaysOn Profiling from the APM landing page and then select a service in the service filter.
Note
If the AlwaysOn Profiling section is not visible, see Troubleshoot AlwaysOn Profiling.
Get familiar with the flame graph 🔗
AlwaysOn Profiling is constantly taking snapshots, or stack traces, of your application’s code. Because reading through thousands of stack traces isn’t practical, AlwaysOn Profiling aggregates and summarizes profiling data, providing a convenient way to explore call stacks.
The flame graph in AlwaysOn Profiling stacks bars from top to bottom, following the hierarchy between function calls, to create a stack frame. The topmost bar, also called the root, is the start of the call stack. The depth of each stack in the flame graph shows the sequence of function calls, until there are no more descendants. There is no horizontal order, as the flame graph arranges bars to save space.
Interpret stack frames 🔗
Each bar in the flame graph is a stack frame, tied to a function in your code. AlwaysOn Profiling extracts the stack frames by aggregating all call stacks during a period of time. When several stack traces start with the same frames, the bars representing those frames merge into a single bar.
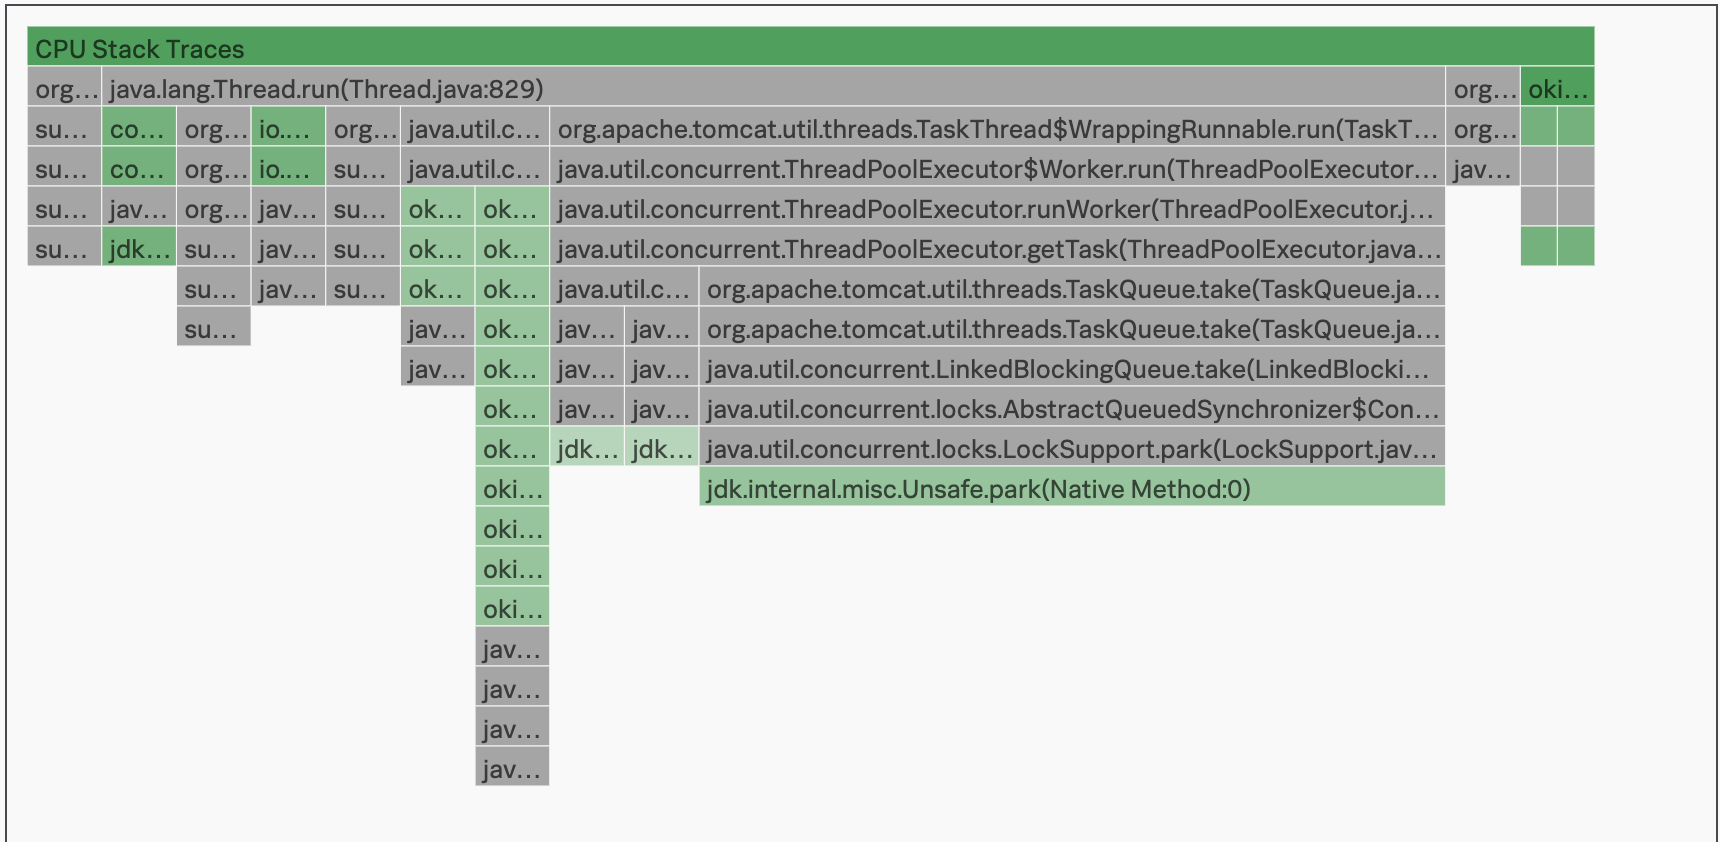
Gray bars in the stack frame are system-level packages. Green bars are your custom code.
The width of each bar is a meaningful indicator of your code’s performance. The wider a bar or stack frame is, the more often the related function appears in stack traces, which might mean that the frame consumes more resources relative to the other stack frames.
Type |
Meaning of stack frame width |
|---|---|
CPU |
Frequency that a function appears in stack traces. CPU usage relative to other stack traces. |
Memory |
Memory allocation by function relative to other stack traces |
The following image shows CPU stack frames for a Java application.
In the AlwaysOn Profiling flame table, each stack frame is labeled with the class name, file name, and line of code for the method called by your application. This same information is available when you hover over bars in the flame graph. Select or hover over a frame to view the following information:
The following image shows a stack frame with its class, file name, and line of code highlighted.

Interpret the frame table 🔗
In the AlwaysOn Profiling table, Count shows how many times a line appeared in stack traces. Self time is the time spent executing the function, minus the time spent calling other functions. A high self time value might also indicate performance issues. Though, in some cases, it might mean the thread is idle and doesn’t consume resources. The following image shows the flame graph with the frame table of threads highlighted:
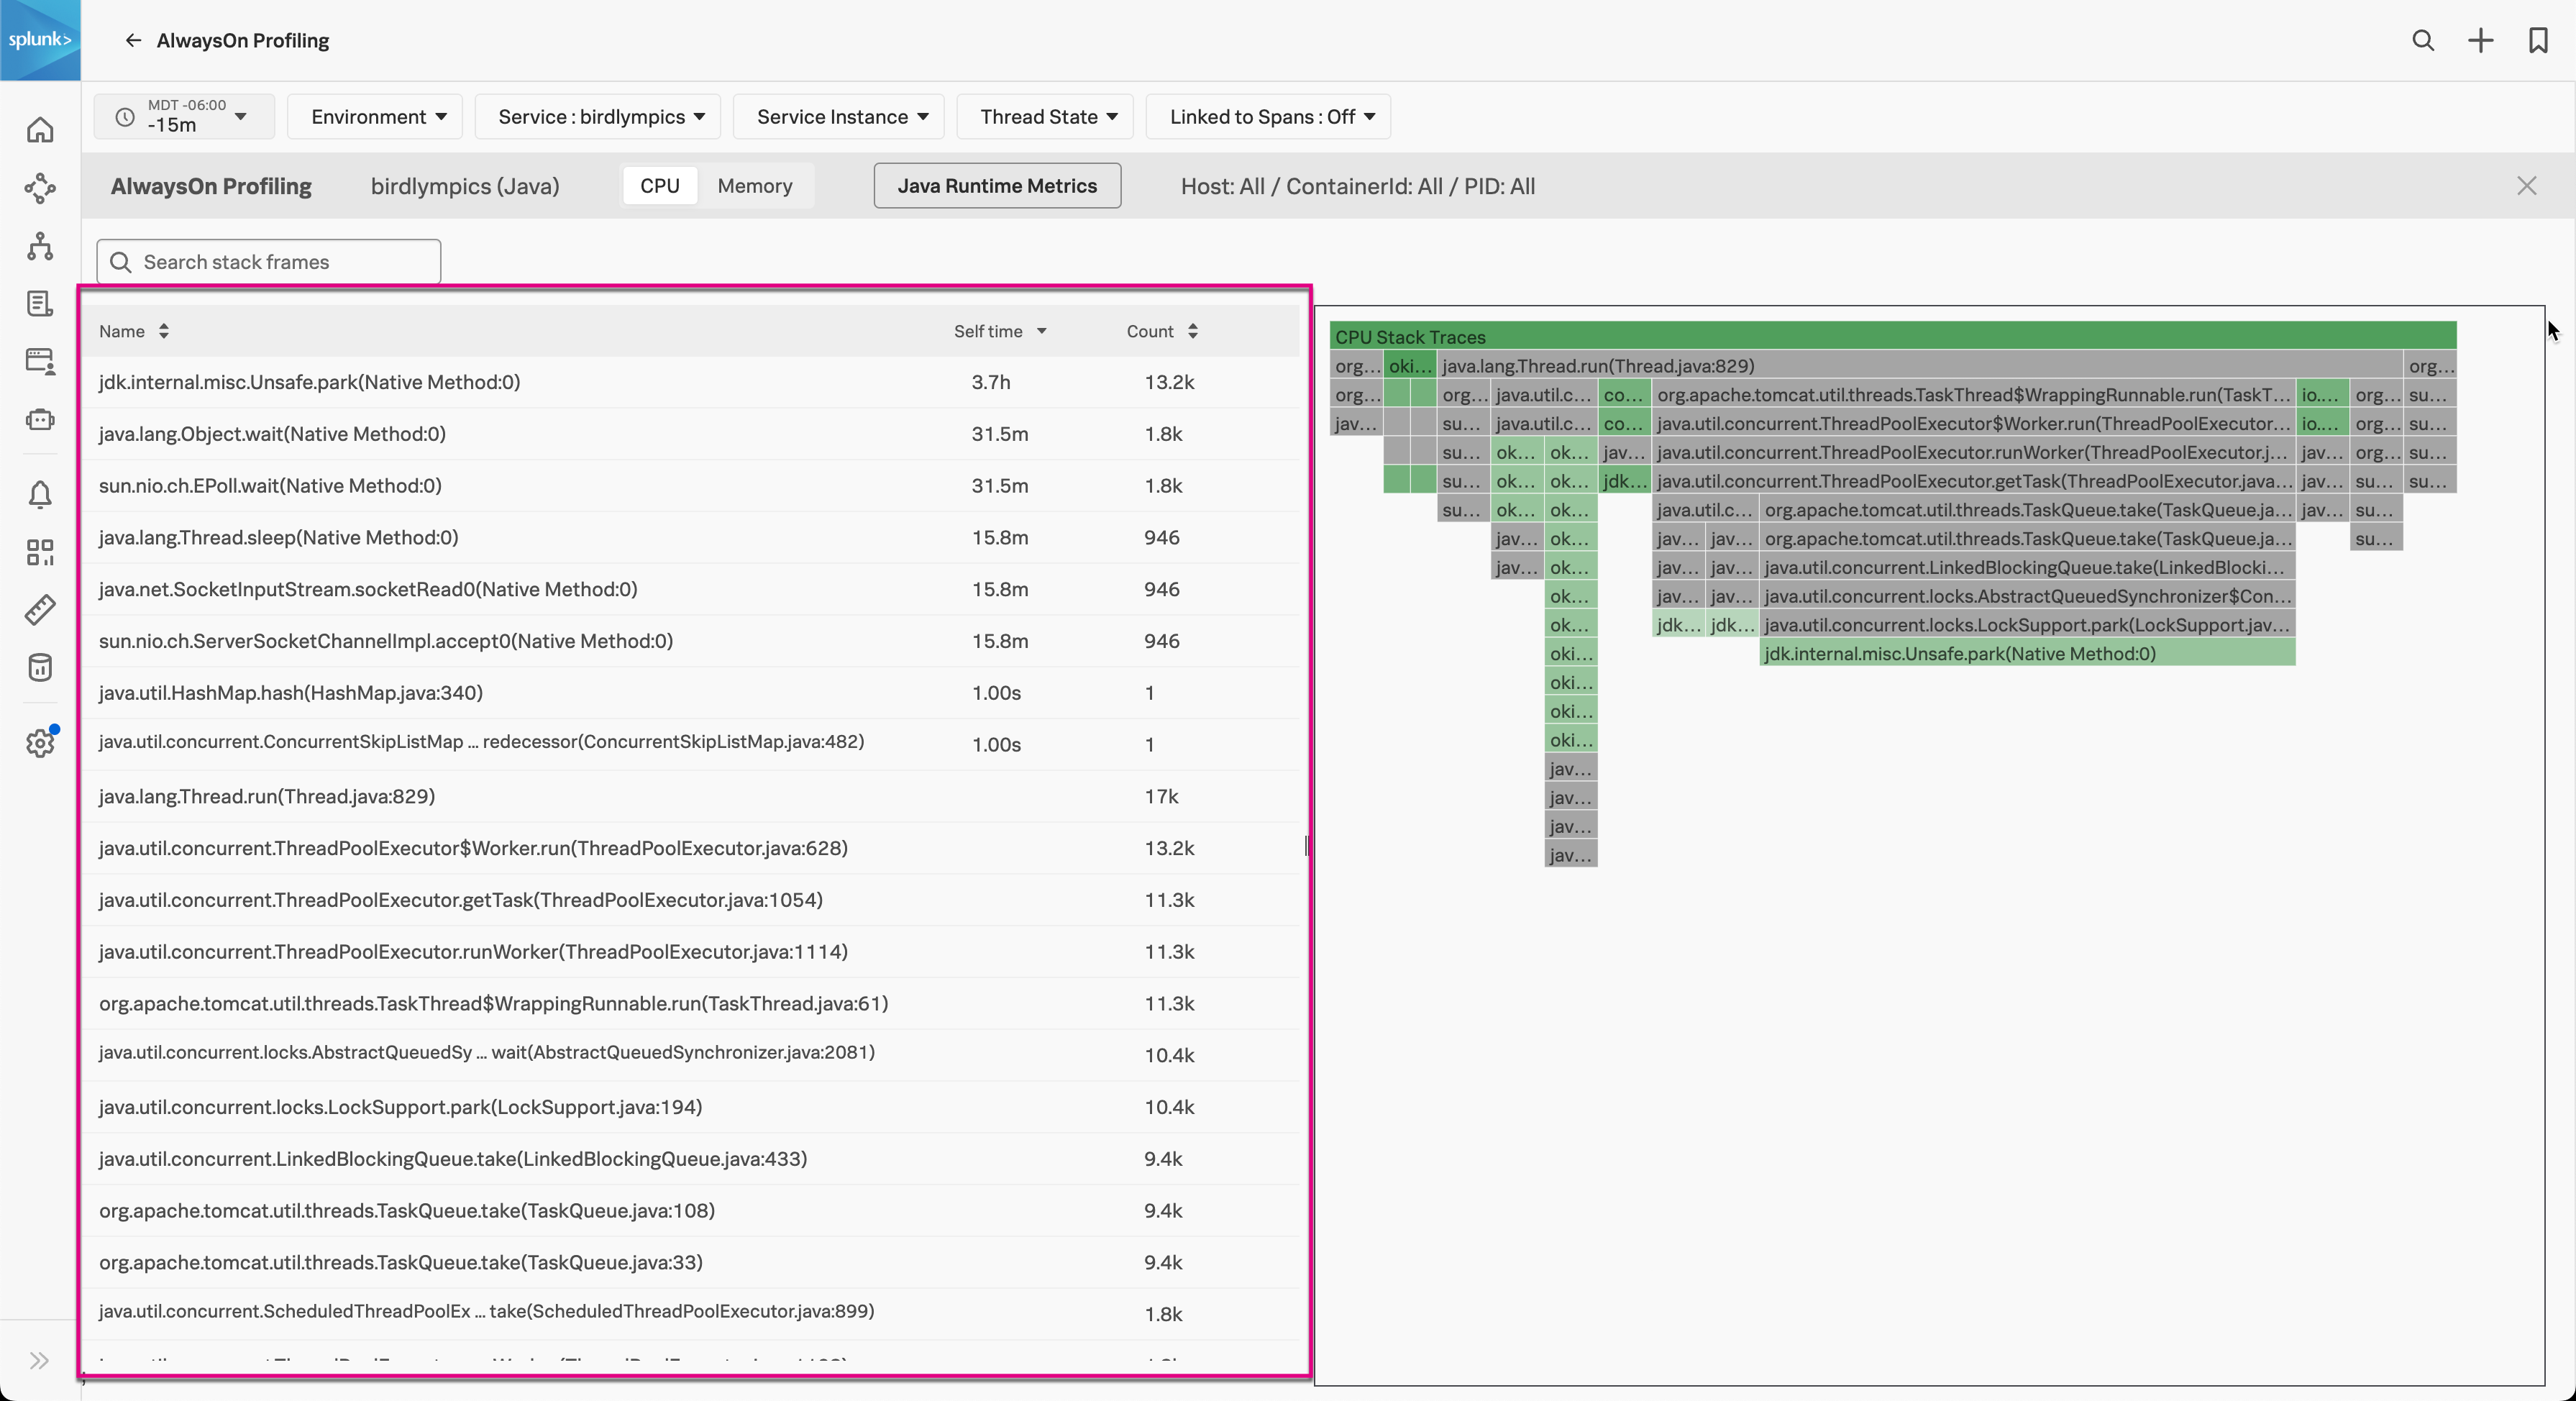
When you select a frame, an information dialog appears with the amount of call stacks where the code is present. Select Show Thread Info to see which threads contributed call stacks.
Search and filter your flame graph 🔗
You can search the details of the stack frame so only the functions you’re looking for are visible.
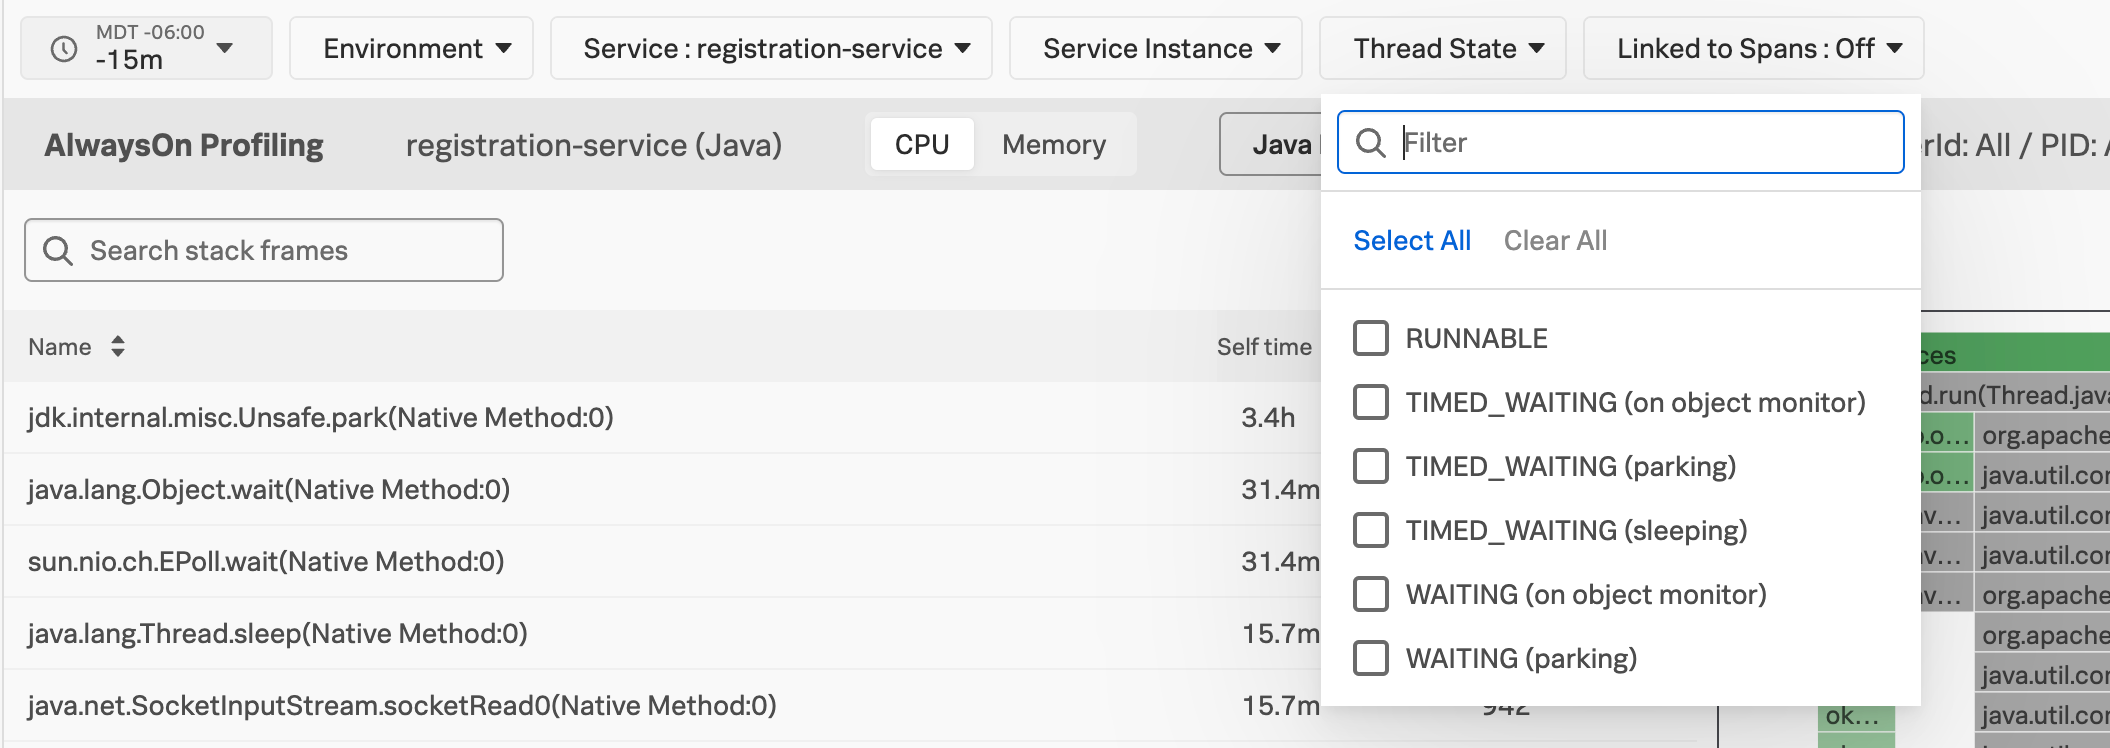
You can also filter stack traces by environment, service, service instance, and thread state. Use Linked to Spans to narrow down the call stacks to only focus on snapshots where APM was receiving spans from your application.
Switch to view CPU or memory 🔗
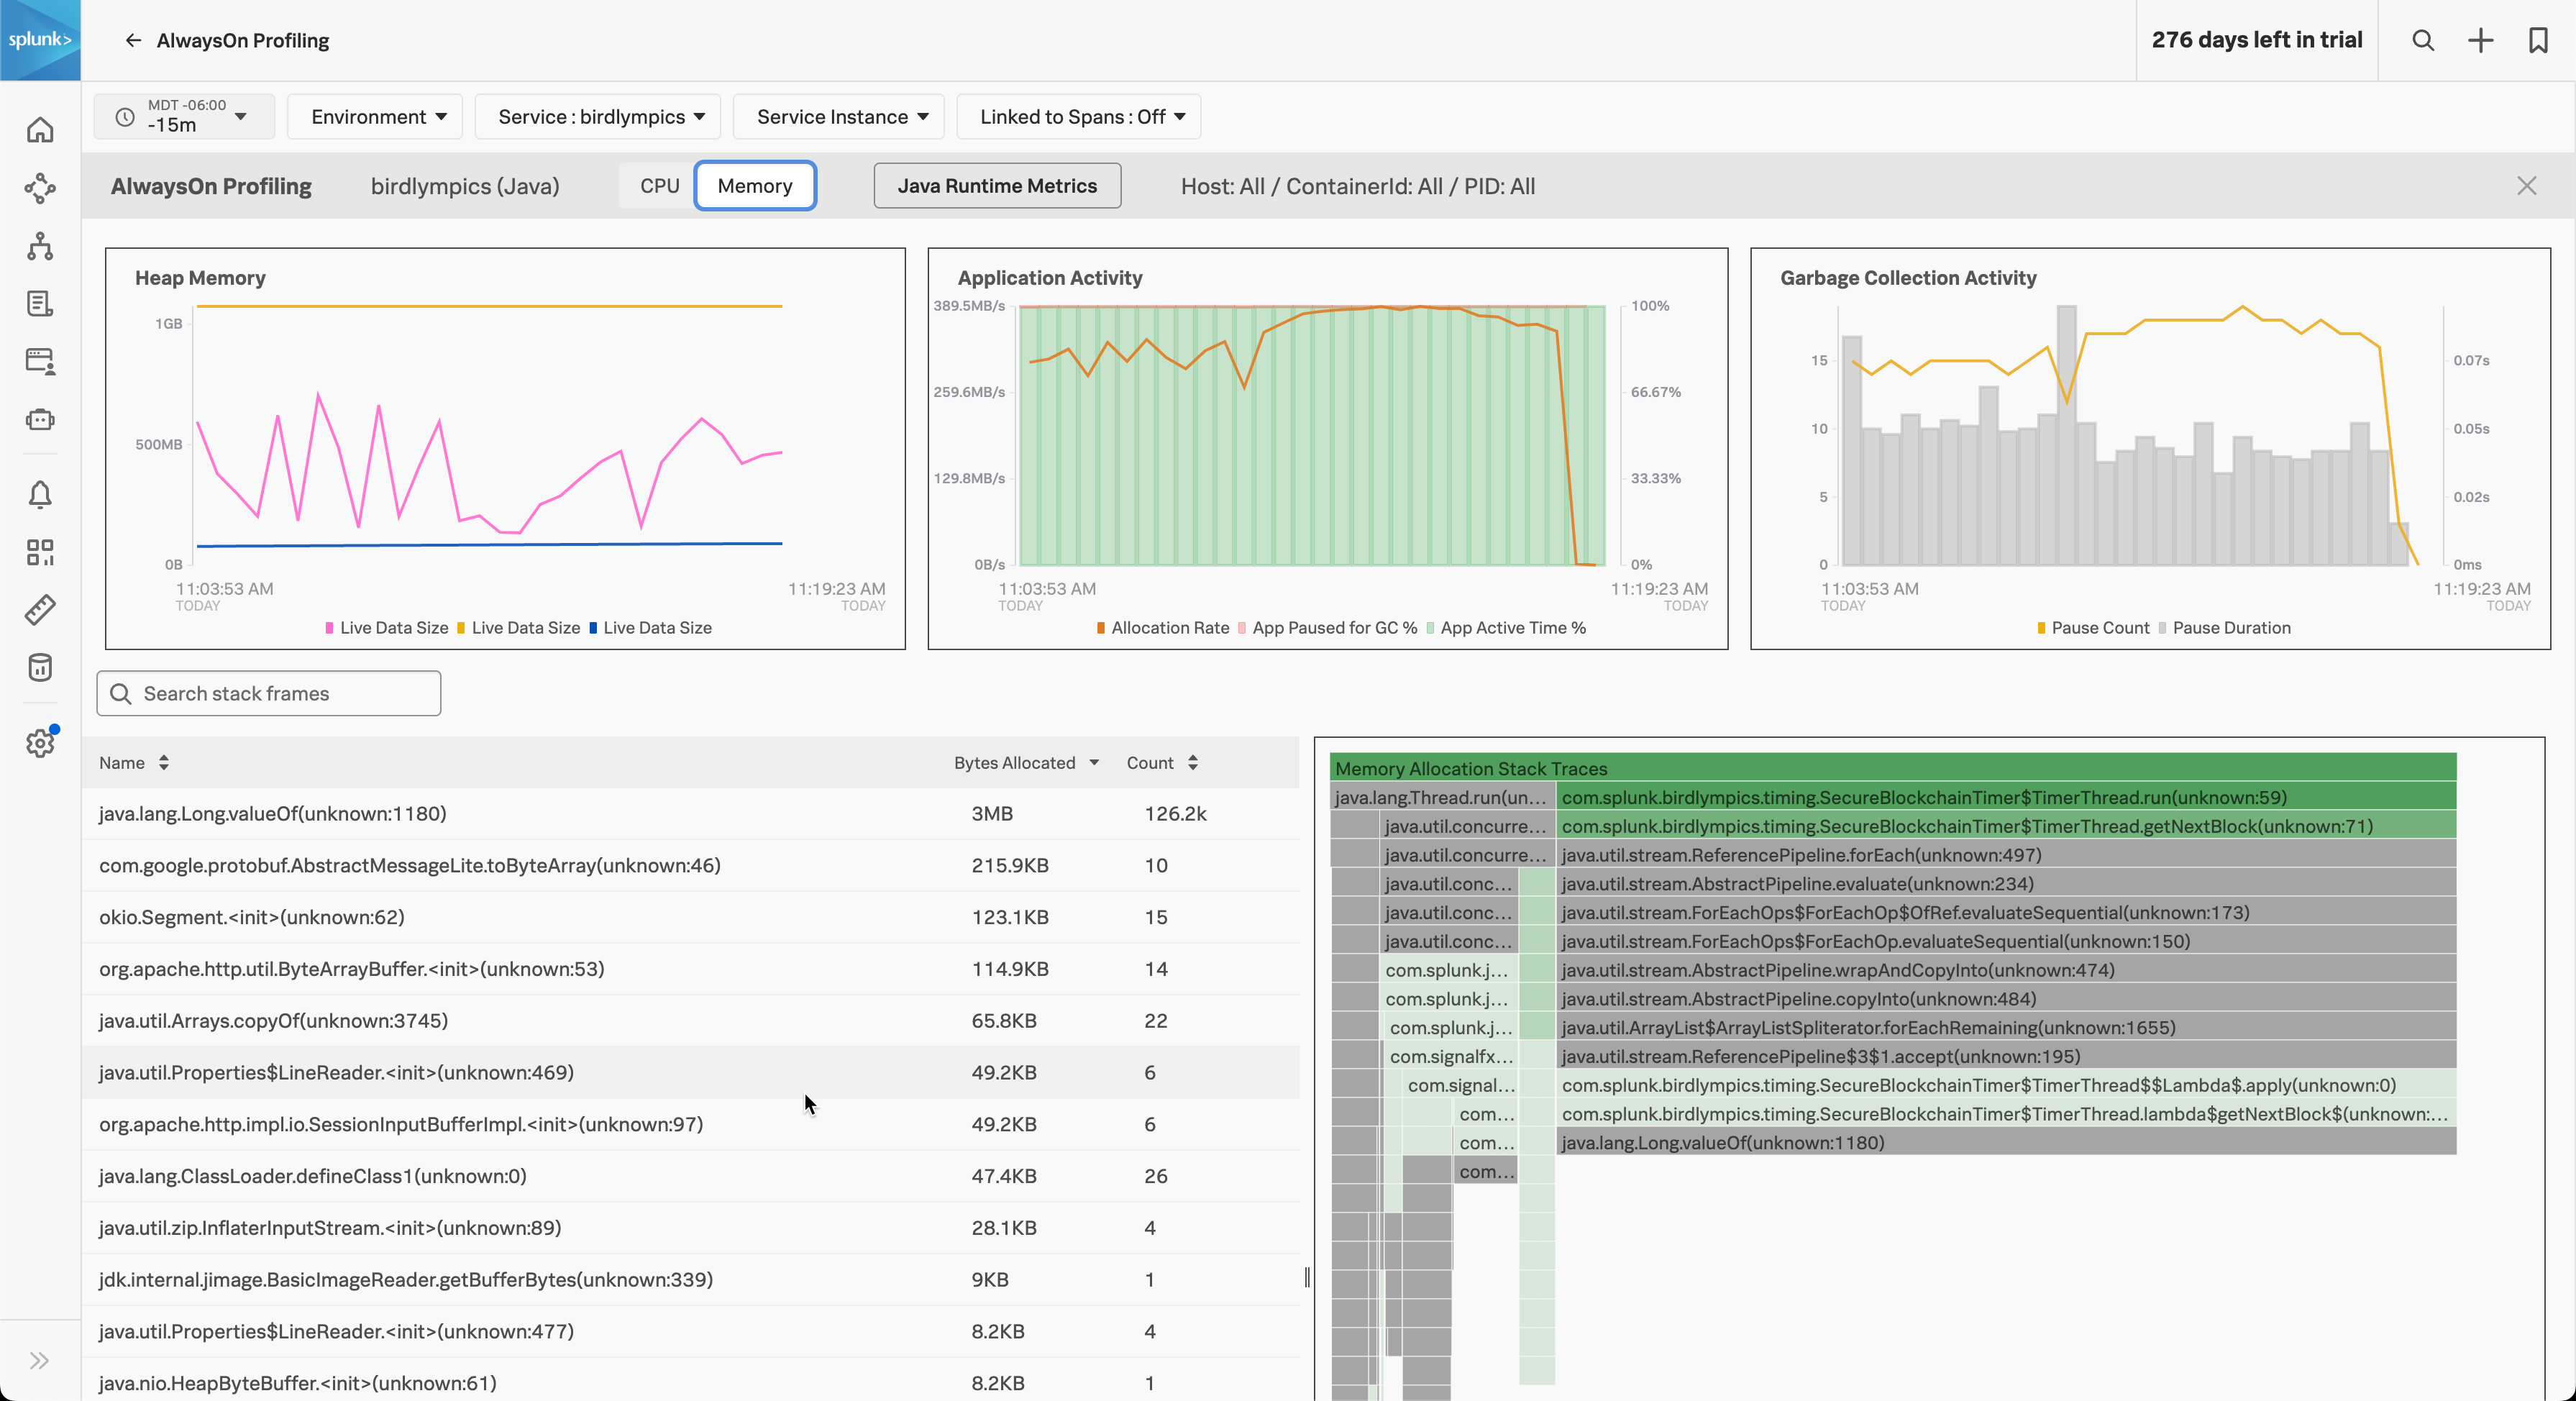
You can switch the view of the AlwaysOn Profiling flame graph between CPU and Memory. Memory data is only available if you activated memory profiling. See Activate AlwaysOn Profiling.
The following image shows the memory profiling flame graph for a Java application:
Use the flame graph to identify and confirm issues 🔗
In most cases, you open the flame graph following the lead of a problematic span or endpoint, or after having identified performance issues in your infrastructure, like a service hitting its CPU or memory limits. Together with the context you get from spans and metrics of your application, the flame graph can assist you in identifying the lines of code that might be causing issues.
The top bars of the flame graph, which are the widest, frequently represent framework code, and might be less relevant for troubleshooting. To highlight your application components, type function or class names in the filter and scroll to the highlighted bars. Select each bar to maximize their width and drill down into the methods called from that function.
The structure of each flame graph depends on the amount of profiling data and on the behavior of the application. Forks in the flame graph indicate different code paths in the dataset. Whenever a function calls other functions, its bar has several bars underneath. The wider a bar, the more calls to the function AlwaysOn Profiling captured.
When you’re examining a frame, the flame graph shows the flow of the code from that point onwards by stacking other frames underneath. Any unusual pattern in the calls originated by the frame can imply issues in your application’s code or opportunities for optimization.
For sample scenarios featuring the flame graph, see Scenarios for monitoring applications and services using Splunk AlwaysOn Profiling.
